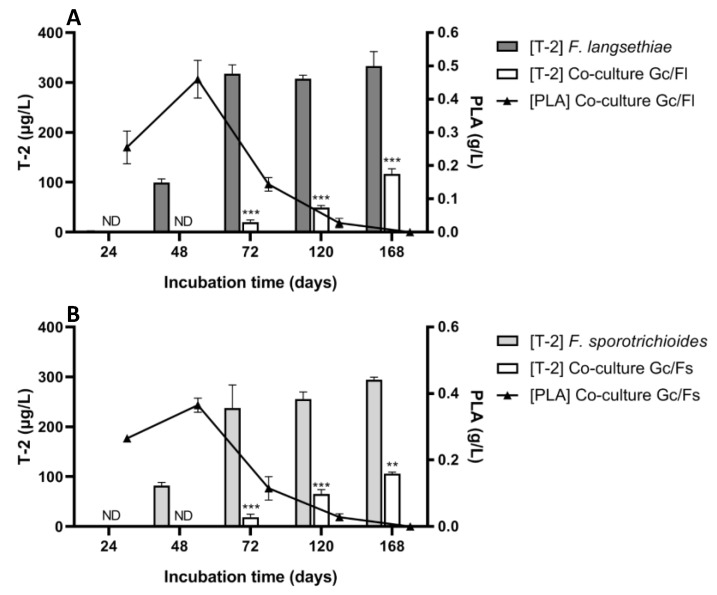
Figure 2.
T-2 concentration (µg/L) and phenyllactic acid (PLA) concentration (g/L) in co-culture experiments. Panel A: Co-culture experiment of G. candidum and F. langsethiae 2297. Panel B: Co-culture experiment of G. candidum and F. sporotrichioides 186 (One-way ANOVA, Tukey’s multiple comparisons post-hoc test, ** p-value < 0.01; *** p-value < 0.001) ND = not detectable.

