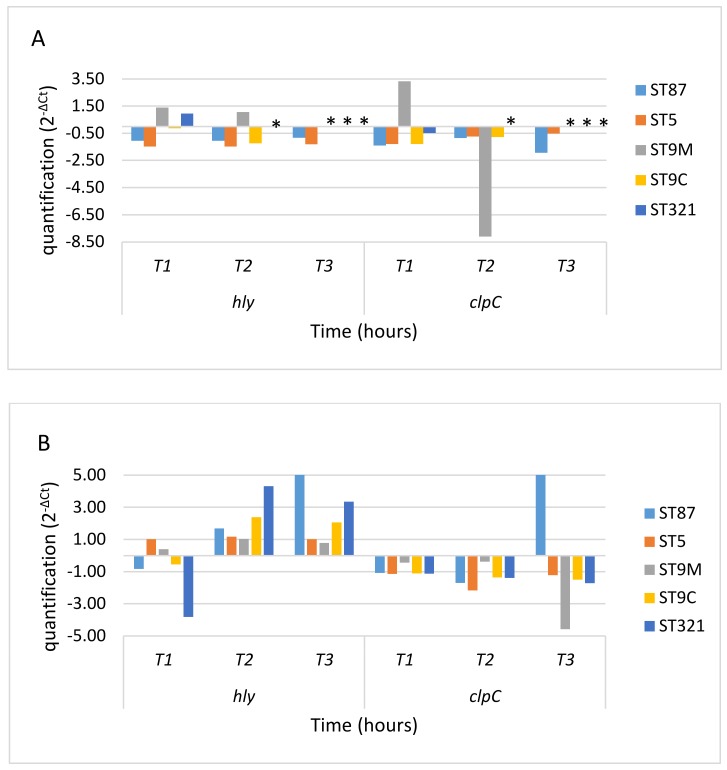
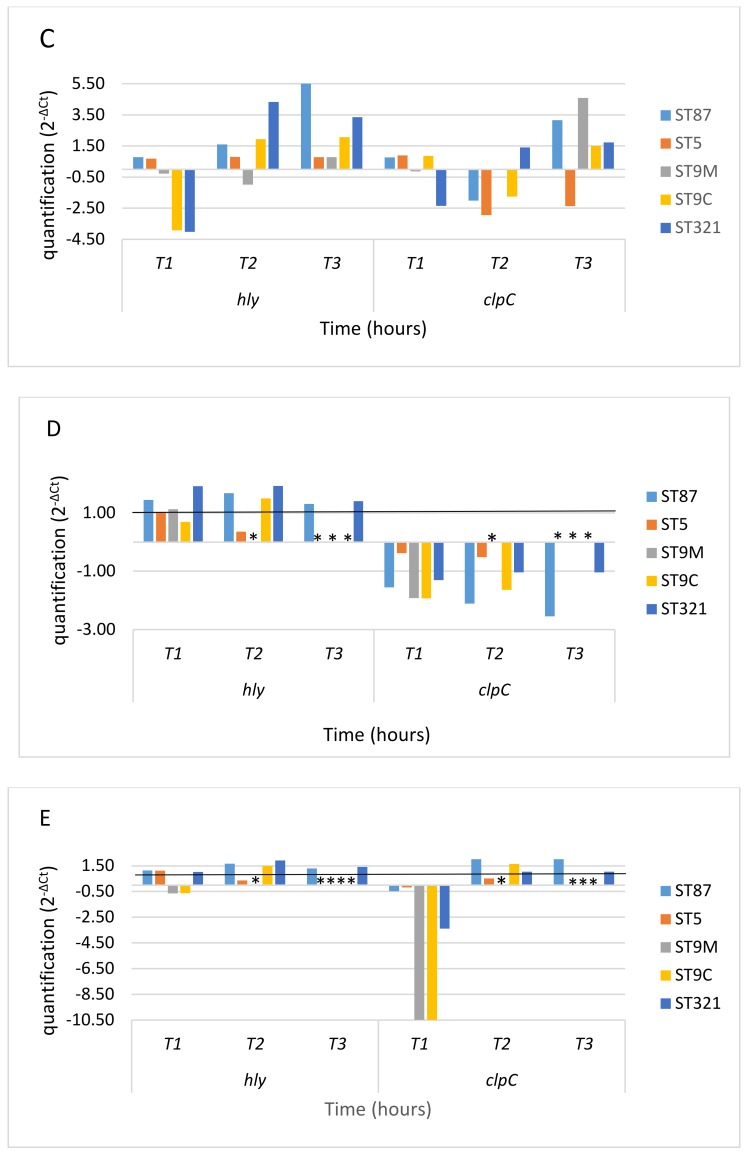
Figure 1.
Expression of hly and clpC genes during oxidative stress. Transcripts of hly and clpC were normalized to those of the ldh gene. Expression of hly and clpC after 1, 2 and 3 hours is shown relative to that before the addition of the oxidizing agents. (A) Exposure to CHP at 37 °C; (B) Exposure to CHP at 10 °C; (C) Expression of hly and clpC in CHP at 10 °C relative to that at 37 °C; (D) Exposure to H2O2 at 10 °C; and (E) Expression of hly and clpC in H2O2 at 10 °C relative to that at 37 °C. Black line: No differences in gene expression with respect T0 (value = 1). *: gene expression results were not studied because cell counts were below the detection limit. T1, T2 and T3: period of time after 1 hour (T1), 2 hours (T2) and 3 hours (T3) of oxidative stress conditions exposure in the L. monocytogenes cultures.


