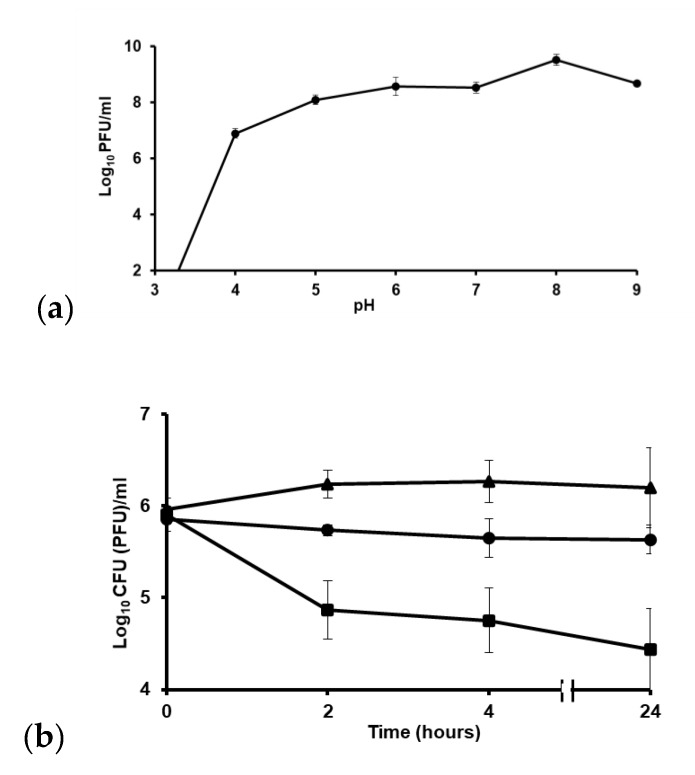
Figure 3.
Phage stability at (a) different pH values shown as means ± standard error. (b) Phage treatment of S. Enteritidis WT (Platten) at 4 °C. This chart shows the drop in bacterial counts after 2 h of incubation with ZCSE2 at 4 °C. The solid circles “●” represent non-infected bacterial counts (CFU/mL), solid black squares “■” represent counts of bacteria treated with phage (CFU/mL), and the solid triangles “▲” represent the phage titer (PFU/mL). The limits of detection were 2 log10 CFU/mL and PFU/mL for bacteria and phage, respectively.

