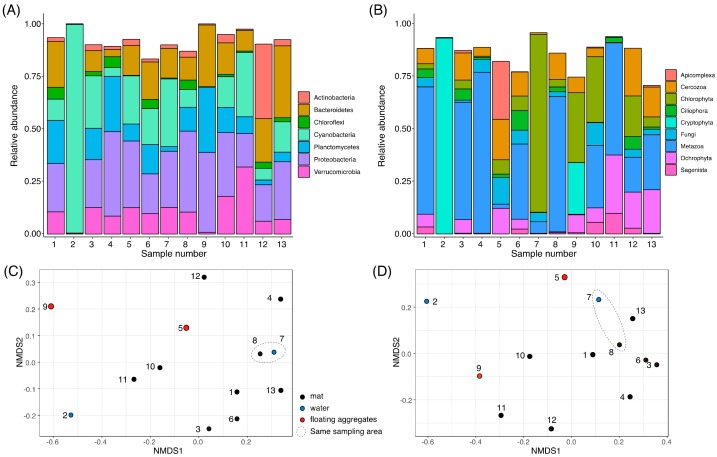
Figure 2.
Overall community structures of collected samples. Bar plots show the composition of sequence variants (SVs) that were agglomerated to the phylum level classification of the SILVA ver. 132 database for 16S rRNA (A) or the Rank 3 classification of the Protist Ribosomal Reference (PR2) database for 18S rRNA (B). Taxa below an average frequency of 2% are not shown. The NMDS plots of the Bray–Curtis distance matrix of each sample are shown for 16S rRNA (C) and 18S rRNA (D).

