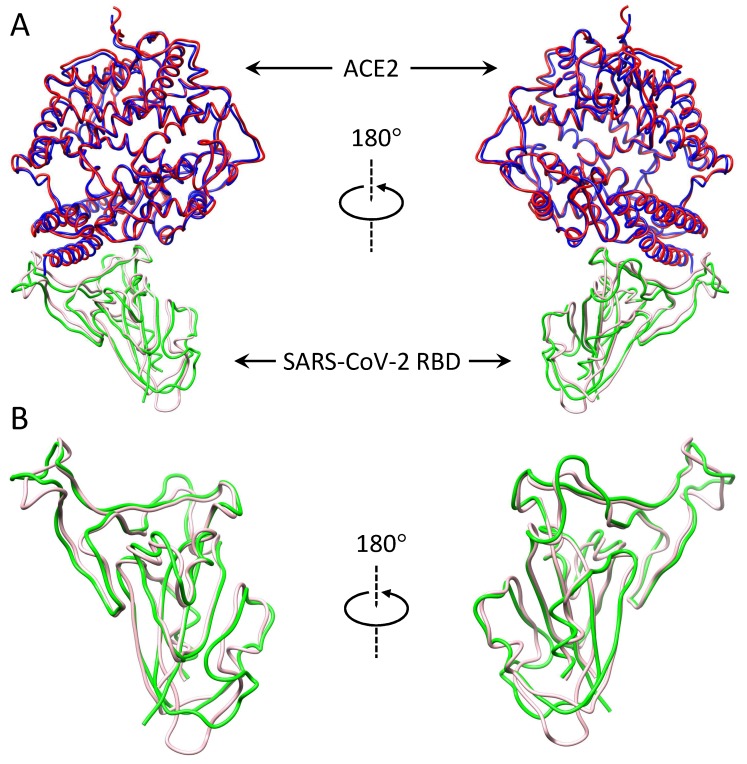
Figure 2.
Structural comparison between the predicted and experimental SARS-CoV-2 RBD-ACE2 complexes. (A) Alignment of the predicted and experimental SARS-CoV-2 RBD-ACE2 complexes. (B) Alignment of the predicted and experimental RBD structures. The RBD and ACE2 of the predicted complex are colored pink and blue. The RBD and ACE2 of the experimental complex (PDB code: 6M17) are colored green and red.

