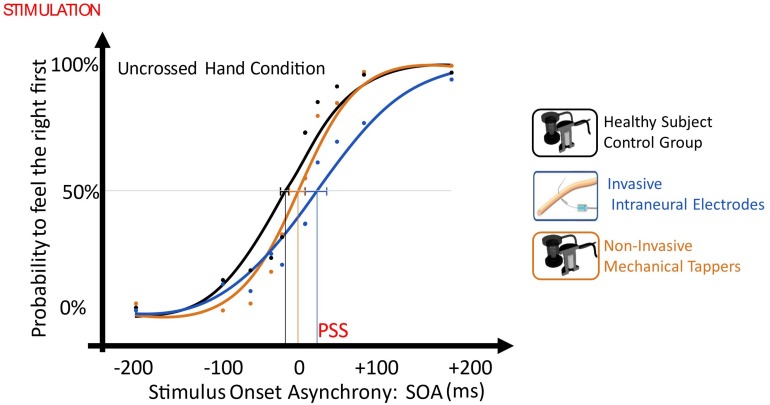
FIGURE 6.
Plot of uncrossed hand order judgment with the different SOAs as independent variable (x-axis, ms) and the probability to judge the right limb as the one stimulated first, as the dependent variable (y-axis). Then, data distribution was fitted with a sigmoid function, and the SOA value in the curve where the first stimulus had the same probability (p = 0.5) to be felt on right and on the left limb was defined as Point of Subjective Simultaneity (PSS) and it testifies the laterality stimulation bias. The dashed lines represent PSS 95% confidence intervals. Blue: Invasive vs Non-Invasive; Orange: Non-invasive vs Non-Invasive; Black: Control.

