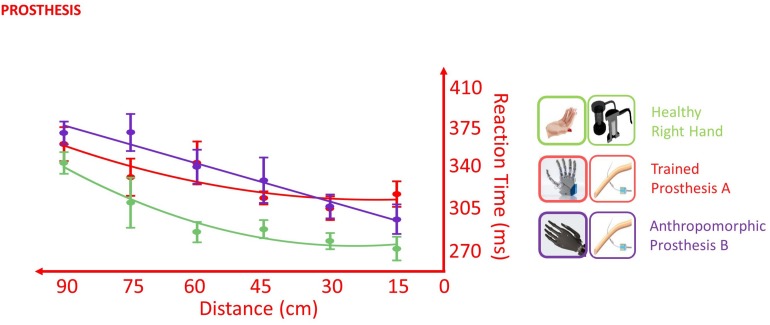
FIGURE 8.
Effect of different prostheses on RT/Distance curves (quadratic fitting function) in the VTI experiment. Values are means (dots) ± SEM (bars). In the POST_I session when the participant was tested with both the prostheses, she was slower for all the tested distances than when she was tested with the right healthy limb (green); however, the RT/Distance pattern was not different (Distance × Hand interaction p = 0.309), which is in favor of an embodiment of both prostheses.

