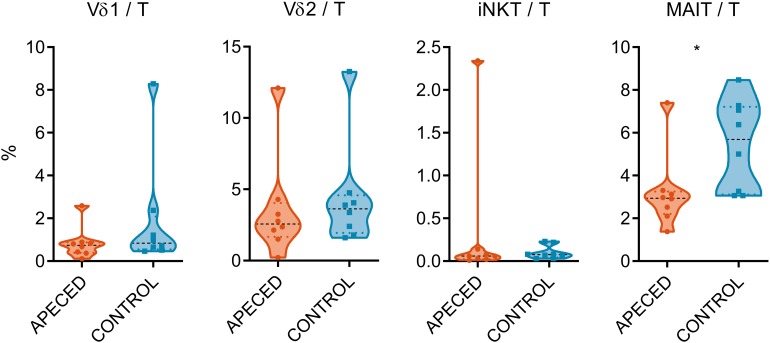
FIGURE 1.
Comparison of circulating lymphocyte subpopulations. Surface marker expression on PBMCs was assessed by flow cytometry in 8 APECED patients and 8 age-matched controls. The percentage of Vδ1+ and Vδ2+ γδ T cells, iNKT and MAIT cells from total T cell pool was compared between patient and control sample groups. In the violin plot the width of distribution of points is proportionate to the number of points at the value of the sample. Black discontinuous line represents median and colored discontinuous line represents quartiles. Statistical significance was assessed with t-test using R statistical software (*p < 0.05). The outliers for different cell types did not overlap, with the exception of the APECED patient who had the highest proportion of both γδ T cell subtypes.

