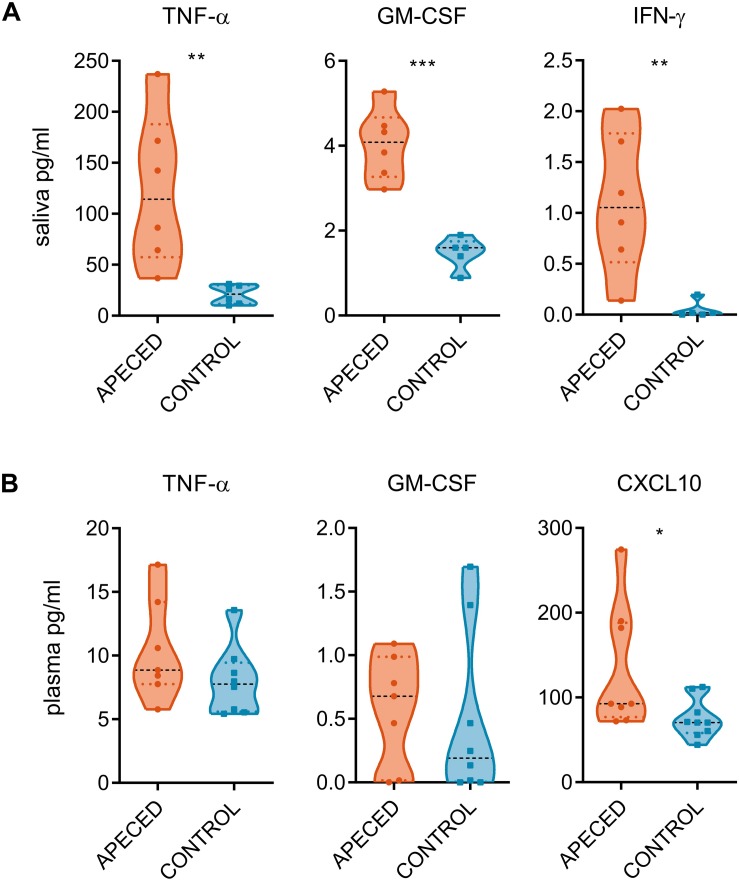
FIGURE 3.
Cytokine quantification. Cytokine measurement assay was conducted on (A) saliva samples (6 patients and 5–6 controls) and on (B) plasma samples (7 patients and 8–9 controls). Concentration of cytokines from the saliva and from the plasma of patient and control samples groups. In the violin plot the width of distribution of points is proportionate to the number of points at the value of the sample. Black discontinuous line represents median and colored discontinuous line represents quartiles. Statistical significance was assessed with the t-test using the Graphpad Prism software (*p < 0.05, **p < 0.01, and ***p < 0.005).

