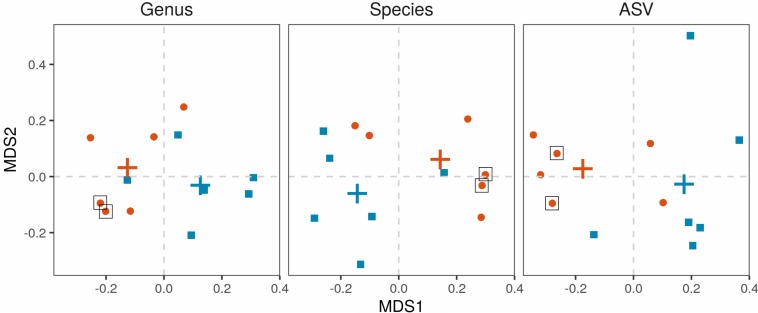
FIGURE 5.
Beta-diversity of the salivary microbiota. Microbiota from salivary samples were analyzed in 6 APECED patients and 6 age-matched healthy controls. Multidimensional scaling based on Bray-Curtis distances was applied with first and second coordinates depicted for genus, species and ASV levels. Each point represents the microbiome of one individual. APECED – orange dots, control individuals – blue squares. Crosses represent centroids per group. Black box – patients with high Candida concentration of saliva samples compared to the normal range of Candida concentration (healthy control values: mean + 3 standard deviations).

