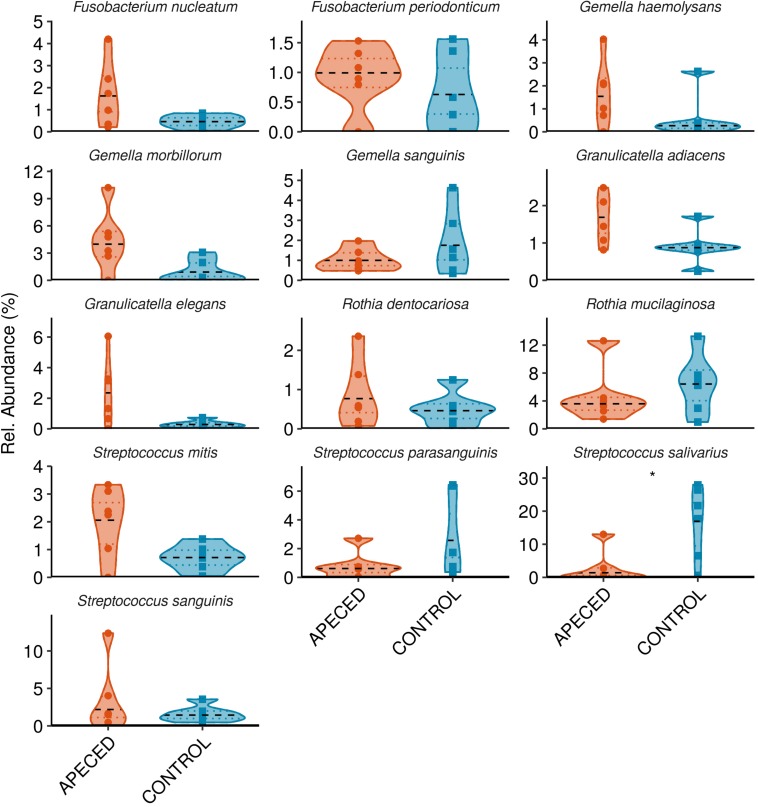
FIGURE 7.
Profiles of the relative abundance per group at species level in studied groups. Microbiota from salivary samples were analyzed in 6 APECED patients and 6 age-matched healthy controls. Analysis was performed using Wilcoxon rank sum test using only taxa with median abundance > 100 sequence counts (0.5% relative abundance) and prevalence > 0.3 (present in at least 4 samples) (*p < 0.05).

