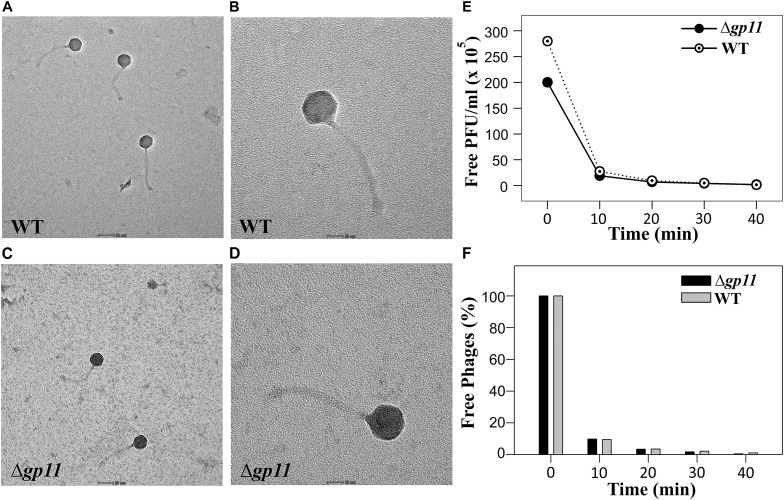
FIGURE 4.
Transmission electron microscopy (TEM) and Phage adsorption kinetics. (A–D) show the TEM imaging of D29WT (Panels A & B) and D29Δgp11 (C,D). The scale bar in (A) and (C) correspond to 50 nm; in (B) and (D), it is 20 nm. (E) and (F) show the phage adsorption kinetics for both D29WT and D29Δgp11, wherein a decrease in the free phage titre is plotted as free PFU/ml (E) and as percentage of free phages present in culture supernatant after infection (F), with respect to time.

