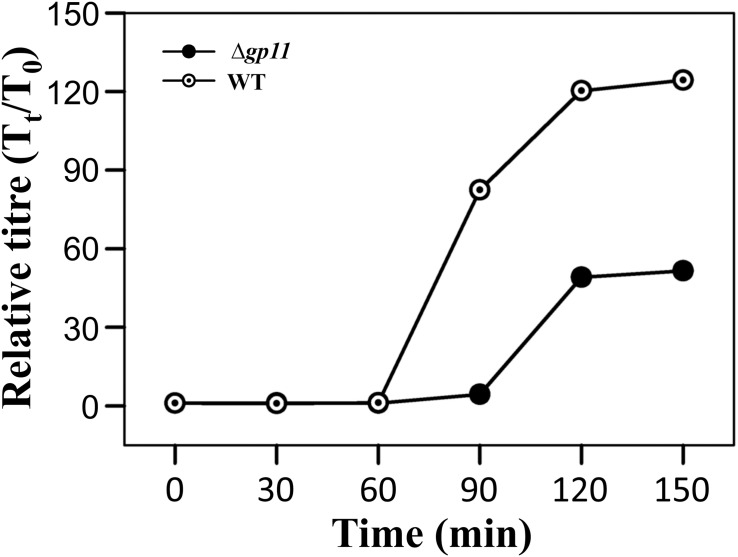
FIGURE 5.
One step growth curve and latent period determination. The plots depict one step growth curve to determine the latent period of infection for both D29WT (WT) and D29Δgp11 (Δgp11). The relative phage titre Tt/T0, where T0 is the initial PFU and Tt is the PFU at time t, obtained at specified time points is plotted. Here, the latent period is the time after which the relative phage titre increases (for D29WT, it is 60 min, whereas for D29Δgp11, it is 90 min).

