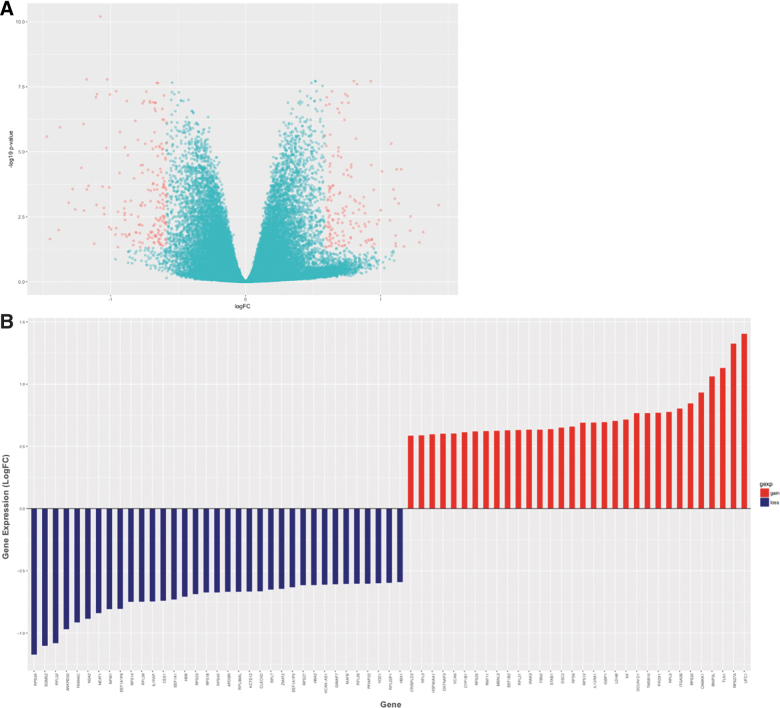
FIG. 3.
Gene expression changes track molecular response to acute exposure to blast. (A) Volcano plot highlighting genes that passed multiple testing correction (6362 genes), that also showed greater than ±1.5 fold change in expression (336 genes, red). The y-axis shows the unadjusted p value. (B) Showing genes (67) with robust expression changes pre- versus post-blast training with fold change ≥|1.5| and excluding rarely expressed genes (logCPM <4). logCPM, log counts per million; LogFC, log fold-change. Color image is available online.

