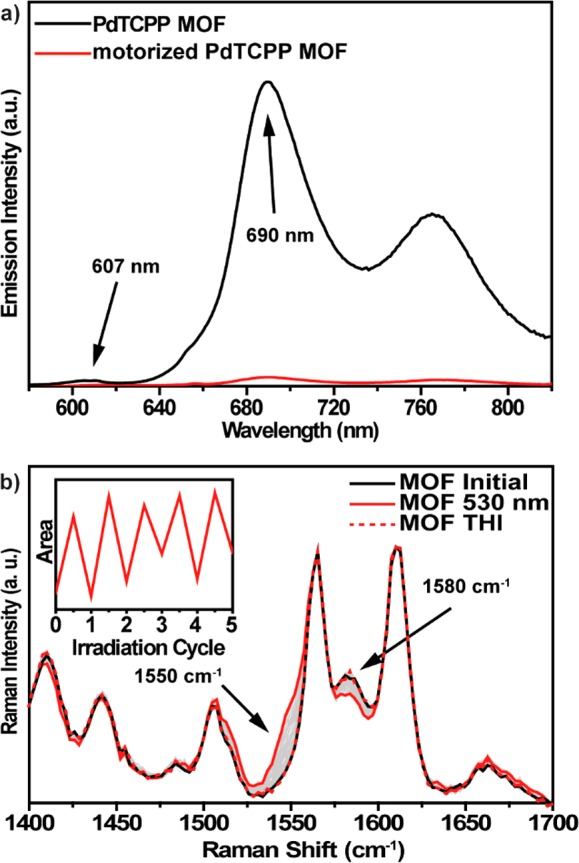
Figure 4.

(a) Comparison of the emission spectra (λexc = 530 nm) of DMF suspensions of parent PdTCPP MOF (black line) and motorized PdTCPP MOF (red line). (b) Changes in the Raman spectrum (1064 nm, 250 mW, 40 s integration time) of the motorized PdTCPP MOF sample (black solid line) upon irradiation at 530 nm (red solid line) and subsequent thermal isomerization (red dashed line). (Inset) Changes in the area around 1550 cm–1 followed upon multiple photochemical/thermal isomerization cycles. Label of ordinate, “Area”, refers to the integrated area between 1530 and 1551 cm–1.
