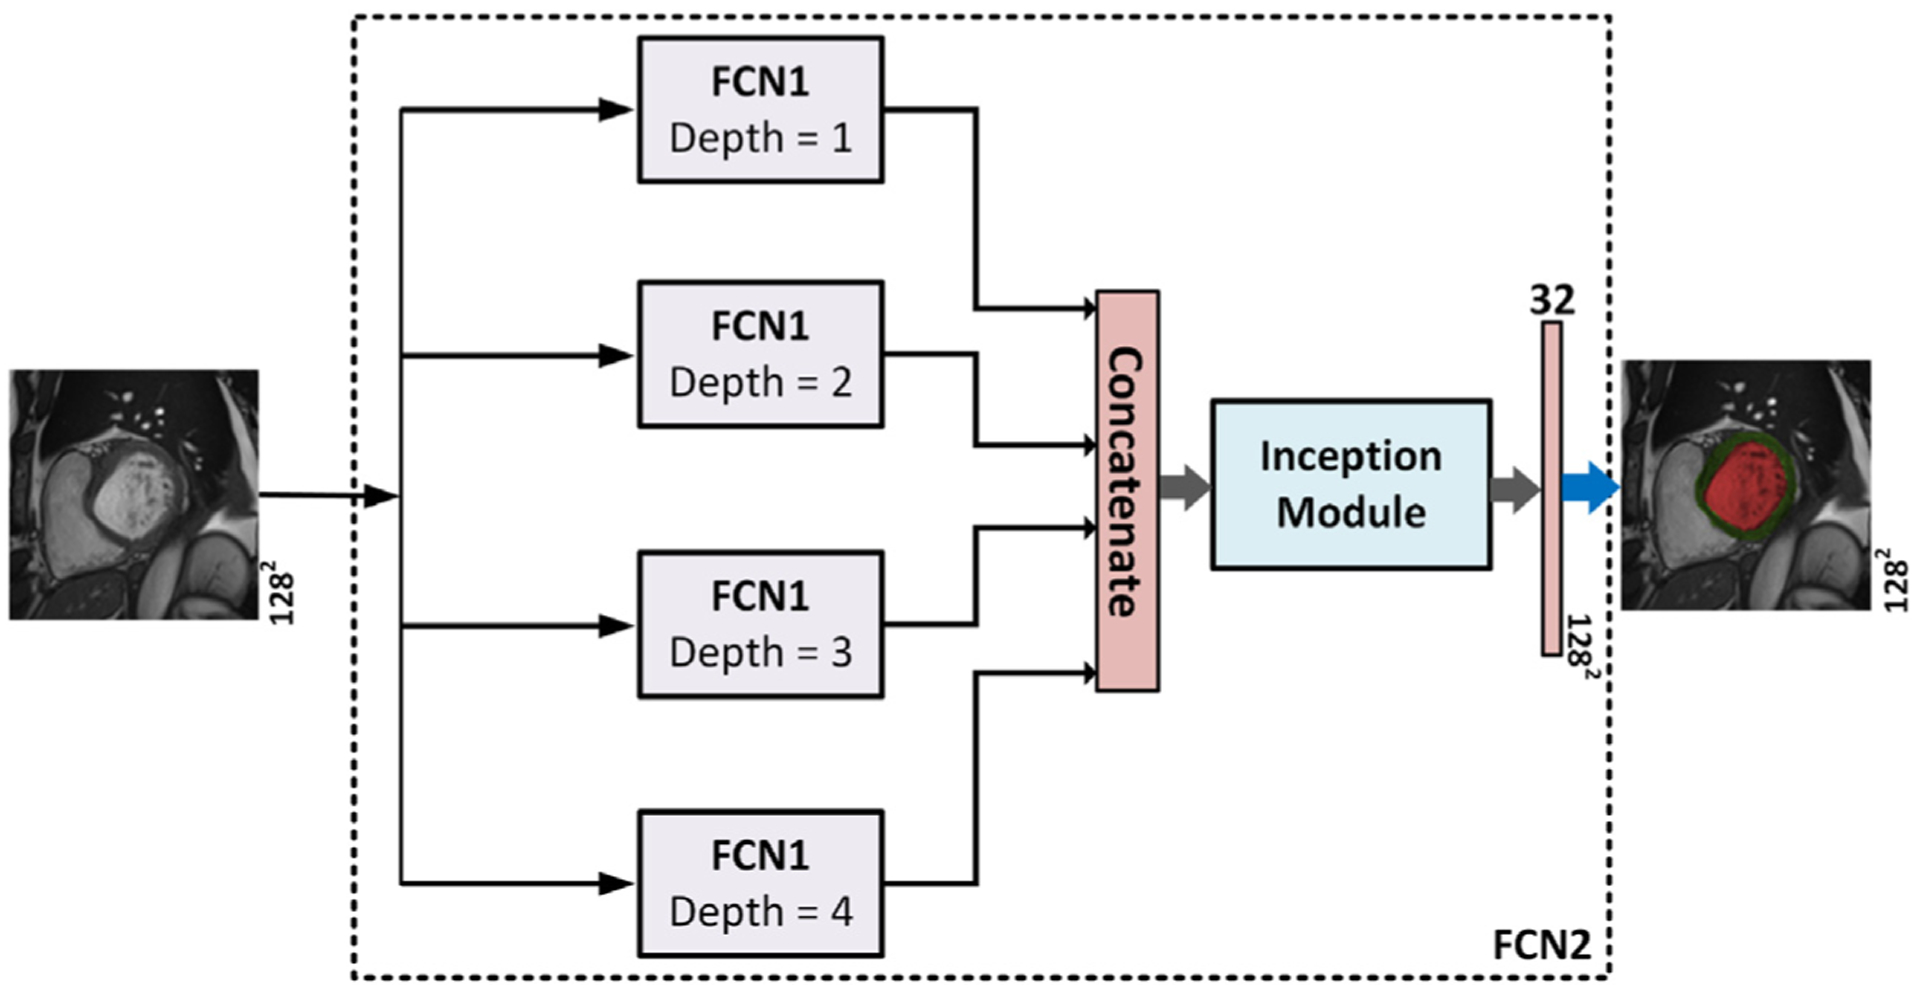
Fig. 5.

The relationship between network FCN1 and network FCN2. Network FCN2 has four FCN1s with various depths and the output of each network is concatenated to form the final segmentation.

The relationship between network FCN1 and network FCN2. Network FCN2 has four FCN1s with various depths and the output of each network is concatenated to form the final segmentation.