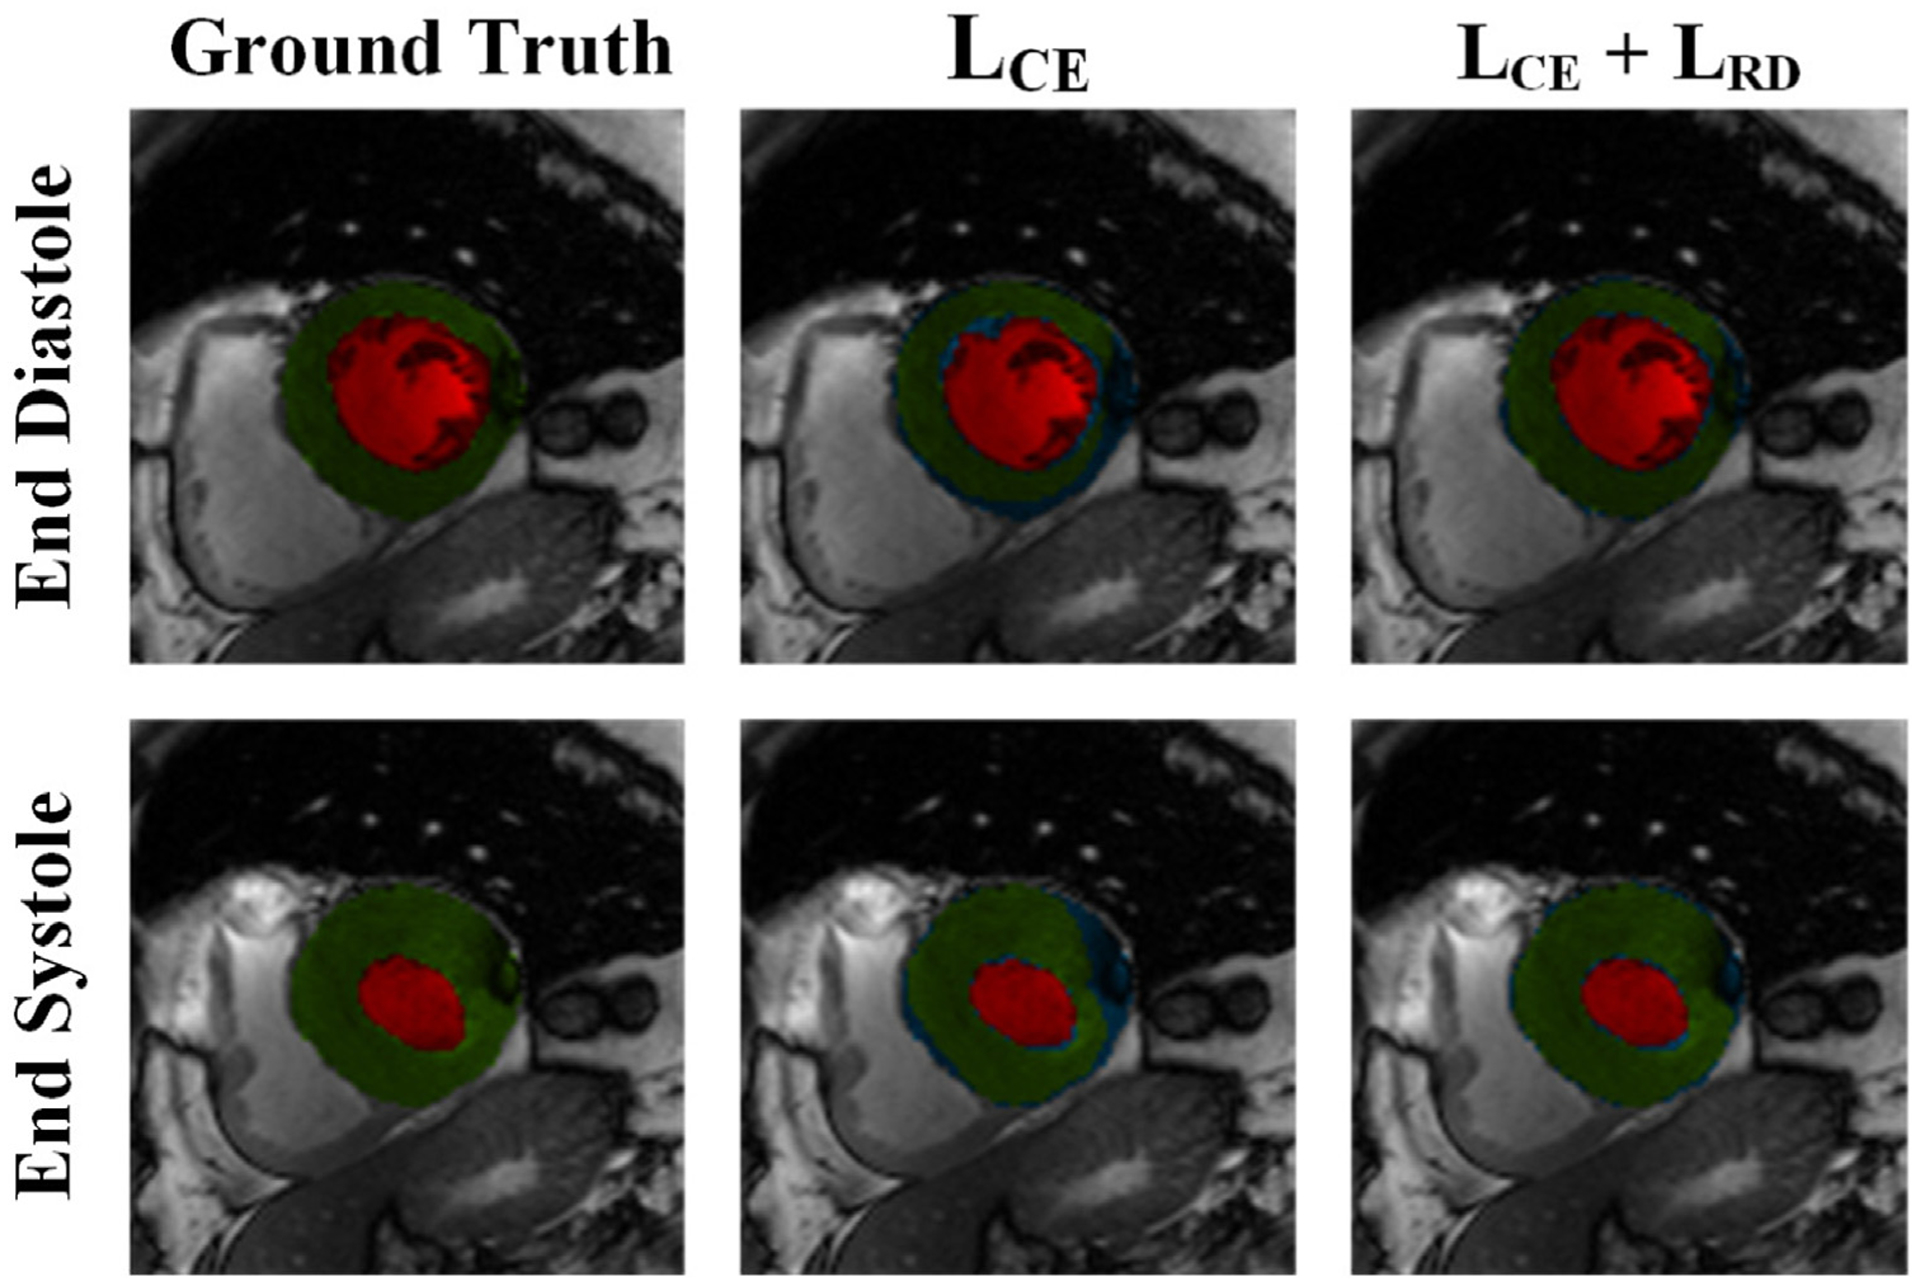
Fig. 7.

Comparison between the manual segmentation of a LV slice in ED and ES phases, the predicted segmentation from FCN2 with LCE loss, and the predicted segmentation from FCN2 with proposed loss (LCE + LRD). Red, and green regions refer to the LV cavity, and myocardium, respectively, while blue color refers to segmentation error. Visual qualitative improvements in the segmentation can be noticed with the proposed loss function.
