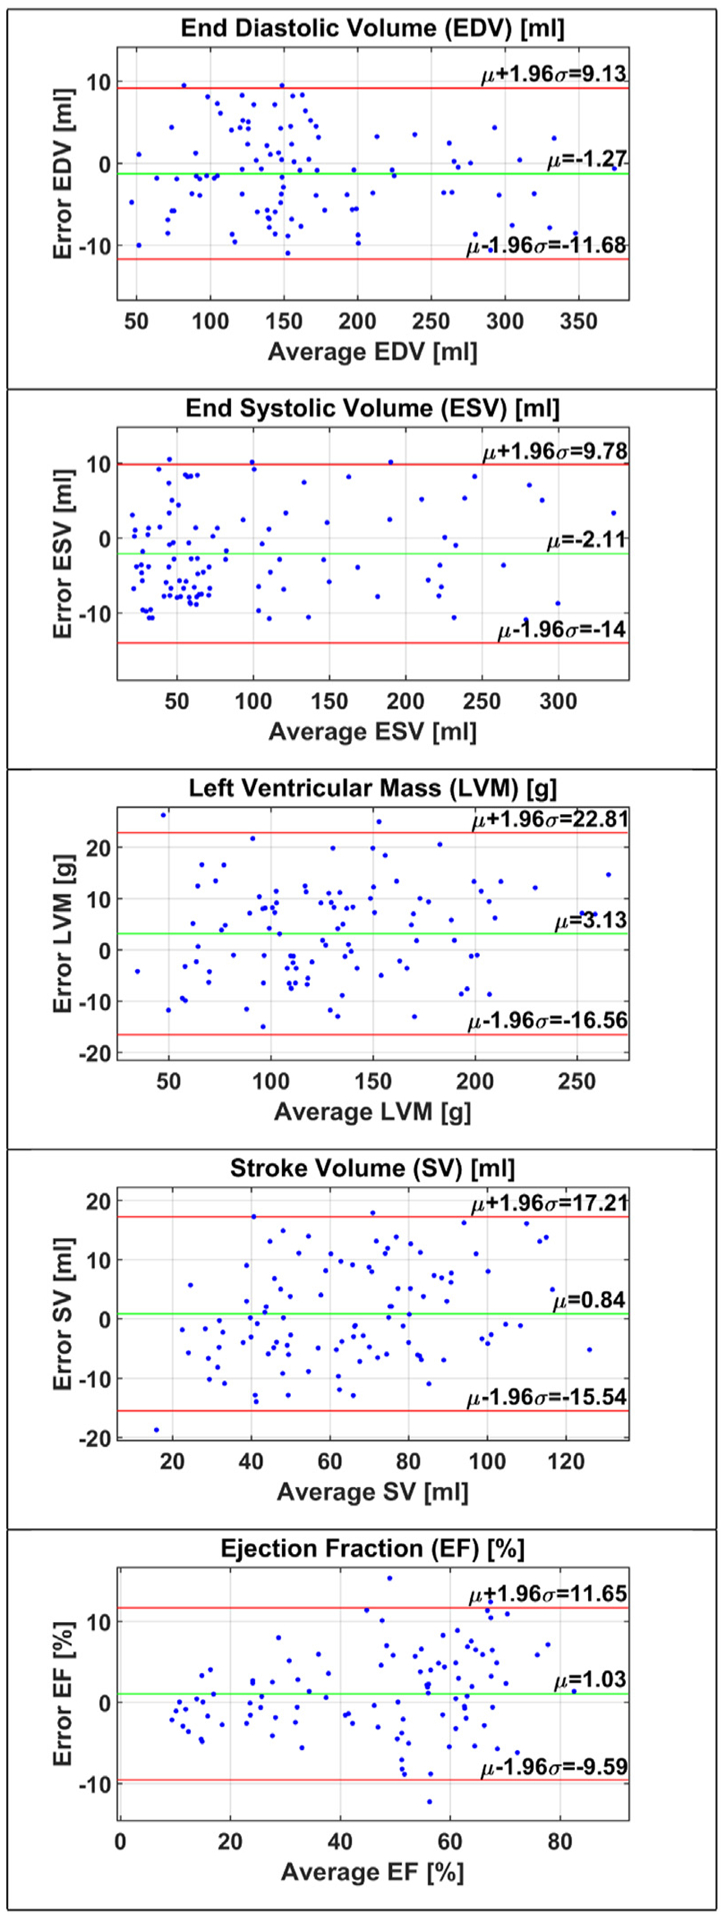
Fig. 9.

Bland-Altman plots for functional parameters. Top-to-down: EDV, ESV, LVM, SV, and EF, where μ is the bias of the estimated values from the ground truth and μ ± 1.96σ represents the 95% confidence interval. To achieve a good agreement, bias should approach the zero value and the error points should lie within the confidence interval.
