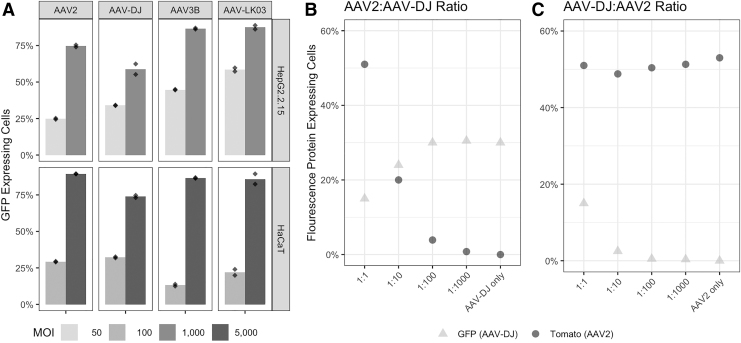
Figure 3.
(A) Analysis of the most and least prevalent AAV serotypes from rounds 1–3 of selection in HepG2.2.15 and HaCaT cells. Cells were transduced in duplicate with two different MOIs (50 and 1,000 for HepG2.2.15 cells and 100 and 5,000 for HaCaT cells) and analyzed by flow cytometry analysis after 48 h. Dots represent each replicate. (B) and (C) AAV2 competes with AAV-DJ for transduction in HaCaT cells. HaCaT cells were transduced with different combinations of both AAV2 (Tomato) and AAV-DJ (GFP) and analyzed by flow cytometry after 48 h. (B) Increasing amounts of AAV-DJ were mixed with AAV2 (left to right). GFP signal increases and Tomato signal decreases with increasing amounts of AAV-DJ. (C) Increasing amounts of AAV2 were mixed with AAV-DJ (left to right). The signals of GFP and Tomato are less affected, indicating less competition.

