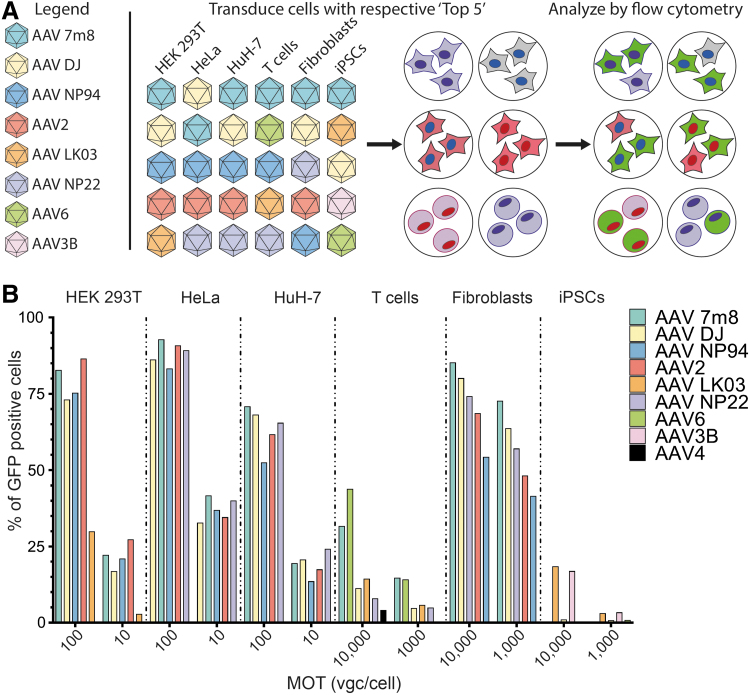
Figure 3.
Analysis of selected AAVs based on transgene expression at the protein level. (A) Schematic representation of the experimental design. The top performing variants (n = 5) for each cell type were used individually to transduce cells, and the vector performance was established by quantifying GFP expression. Individual variants used are color coded for clarity. (B) Results of FACS analysis for each cell type transduced with its respective “Top 5” AAV variants. FACS, fluorescence-activated cell sorting.

