Figure 13.

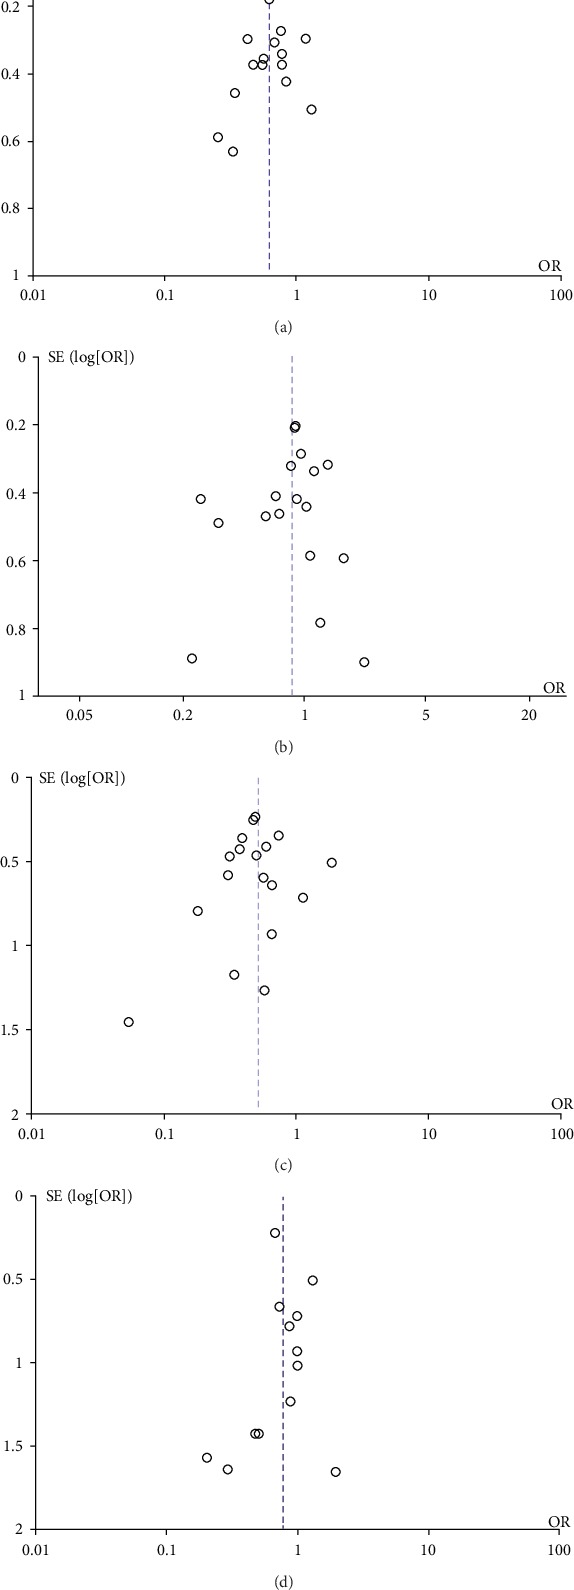
Funnel plot of overall postoperative complications (a), pancreatic fistula (b), delayed gastric emptying (c), and morbidity (d) in all included studies. SE: standard deviation; OR: odds ratio.

Funnel plot of overall postoperative complications (a), pancreatic fistula (b), delayed gastric emptying (c), and morbidity (d) in all included studies. SE: standard deviation; OR: odds ratio.