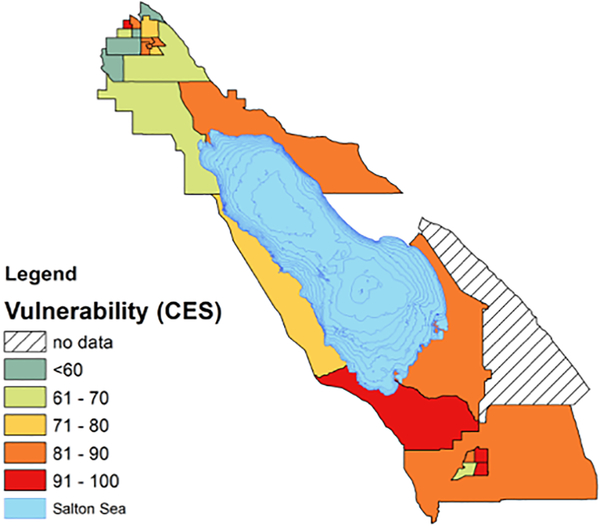
Figure 4.
Map of census tracts surrounding the Salton Sea, colored by CalEnviroscreen population characteristics, which represent biological traits, health status and community indicators that can increase vulnerability to pollution. CES population vulnerability percentile is calculated by assigning percentile scores for multiple population characteristics, to individual census tracts in California. Nearly all census tracts in Imperial County scored rank among the top 20% of census tracts most vulnerable to pollution.

