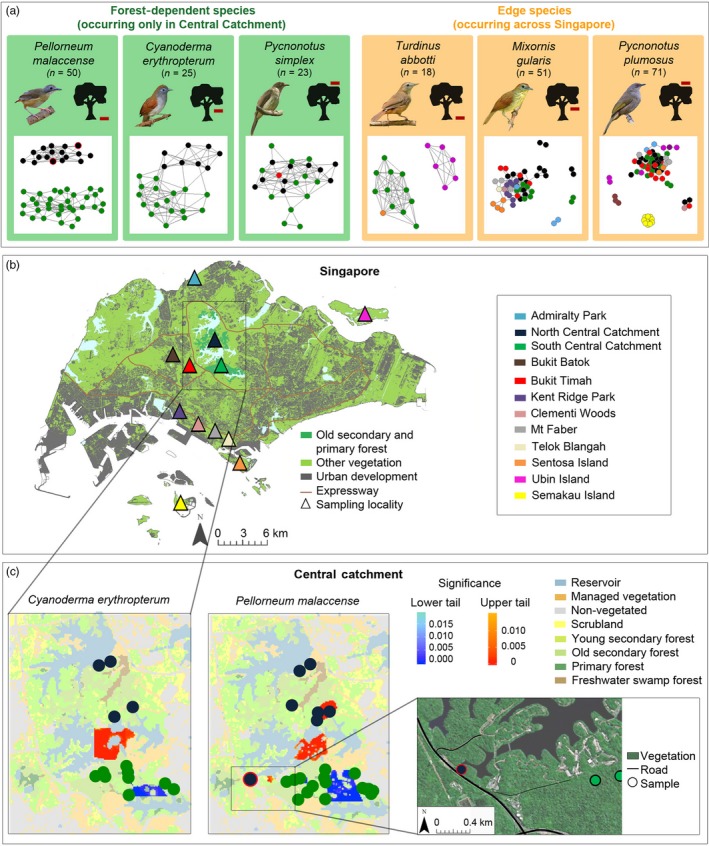
Figure 1.

Population structure of Pellorneum malaccense, Cyanoderma erythropterum, Turdinus abbotti, Mixornis gularis, Pycnonotus plumosus and Pycnonotus simplex across Singapore. (a) Population clustering based on network analysis at k = 10. Each dot represents one sample coloured according to sampling locality (see panel b). Red horizontal bars next to the black trees indicate forest stratum. Bird pictures courtesy of Daniel Koh; (b) Singapore map and sampling localities (adapted from Yee et al., 2011). (c) Barriers to and conduits for gene flow in the forest‐dependent C. erythropterum and P. malaccense in the Central Catchment using spatially explicit individual‐based analysis. Areas dominated by pairwise genetic divergences significantly higher (p < .05) than assumptions of isolation by distance are shown in hues of red and indicate the presence of barriers. A genetic similarity significantly higher than expected from isolation by distance is shown in hues of blue, indicating areas between relatively closely related individuals. Dot colour (green vs. black) corresponds to sampling localities following panel b
