
Figure 5.
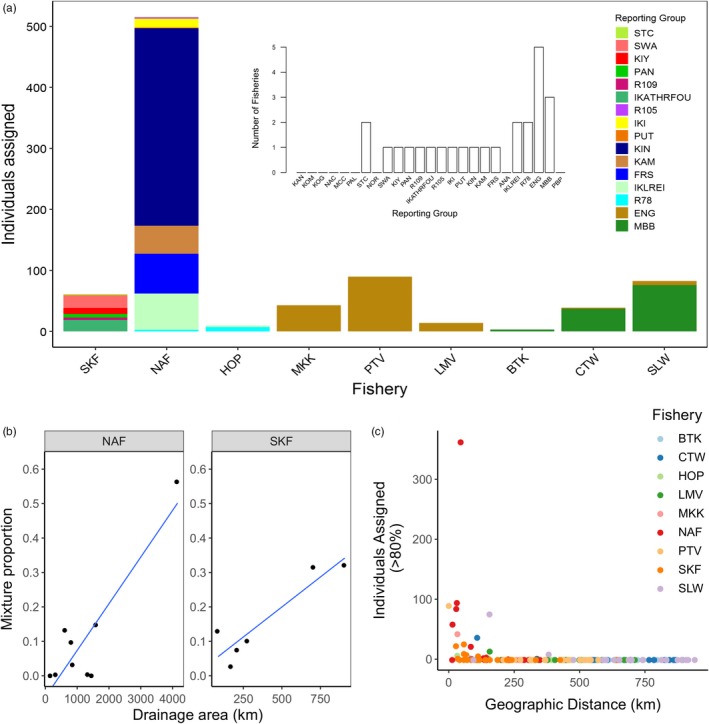
Genetic mixed stock fishery analysis. (a) Number of individuals from each reporting group that assigned to a mixed stock fishery with greater than 80% probability (inset: number of mixed stock fisheries that each reporting unit contributes to). Populations are ordered by decreasing latitude. (b) Linear regression of the relative proportion of multiple reporting groups contributing to the NAF and SKF mixed stock fisheries and drainage area for those reporting groups (R 2 = .44, p = .004). (c) Number of individuals assigned to a reporting group from each of nine mixed stock fishery samples and the geographic distance between the assigned reporting group and mixed stock fishery