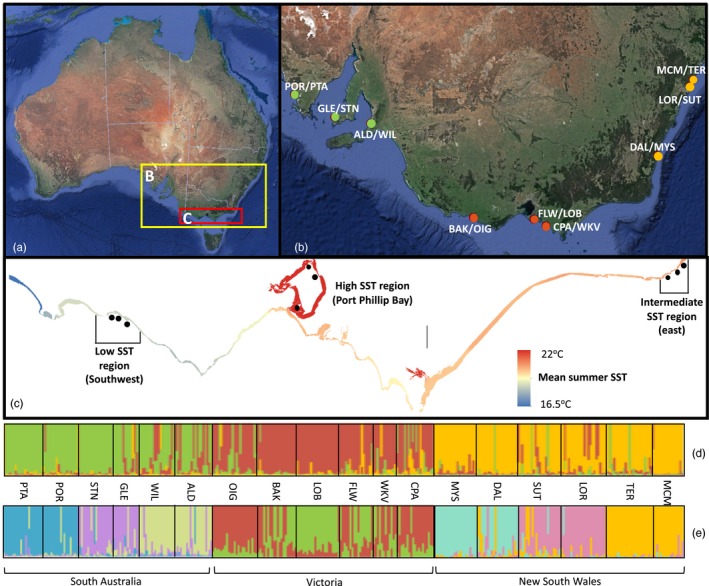
Figure 1.

Maps showing Hormosira banksii sampling locations for the population genetic analysis (map “B”) and common garden experiments (map “C,” modified from Ierodiaconou et al., 2018). Map c shows the nesting of collection sites within three distinctive temperature zones (low, intermediate, and high), with the coastline color coded according to local mean summer sea surface temperatures (SST). Summary plots of the population subdivision based on STRUCTURE analyses of Hormosira banksii multilocus genotypes are also included (“d” and “e”). Single vertical lines broken into segments reflect each individual in the STRUCTURE summary plot, where segments are proportional to the membership coefficient for each of the population clusters. Individuals are arranged into sites from which they were sampled following the order given in Table 1 (site codes are also derived from Table 1). STRUCTURE plots are provided for the first hierarchical level of structure (all states included in the analysis; plot “d”) and the second hierarchical level of structure (independent analysis of sites from New South Wales, Victoria, and South Australia; plot “e”)
