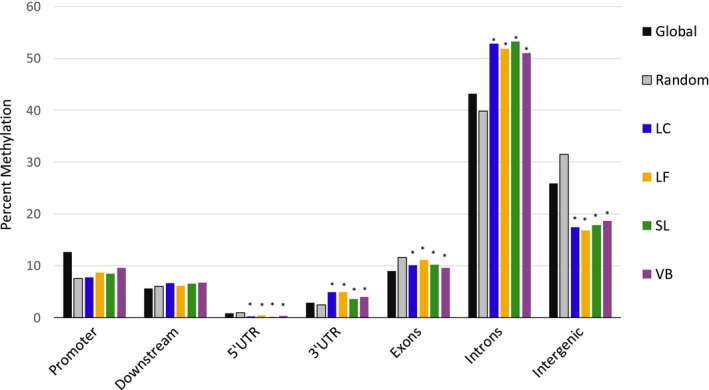
Figure 3.

Distribution of percent methylation across genomic regions. Global DNA methylation (black) and the mean distribution of randomly generated markers (gray) distribution of methylated cytosines across gene regions. Site specific mean methylation of DMRs for each genomic region is also shown in color; (Blue—Lake Calcasieu; Orange—Lake Fortuna; Green—Sister Lake; Purple—Vermillion Bay). Stars indicate samples are significantly different from the mean distribution of random markers
