
Figure 6.
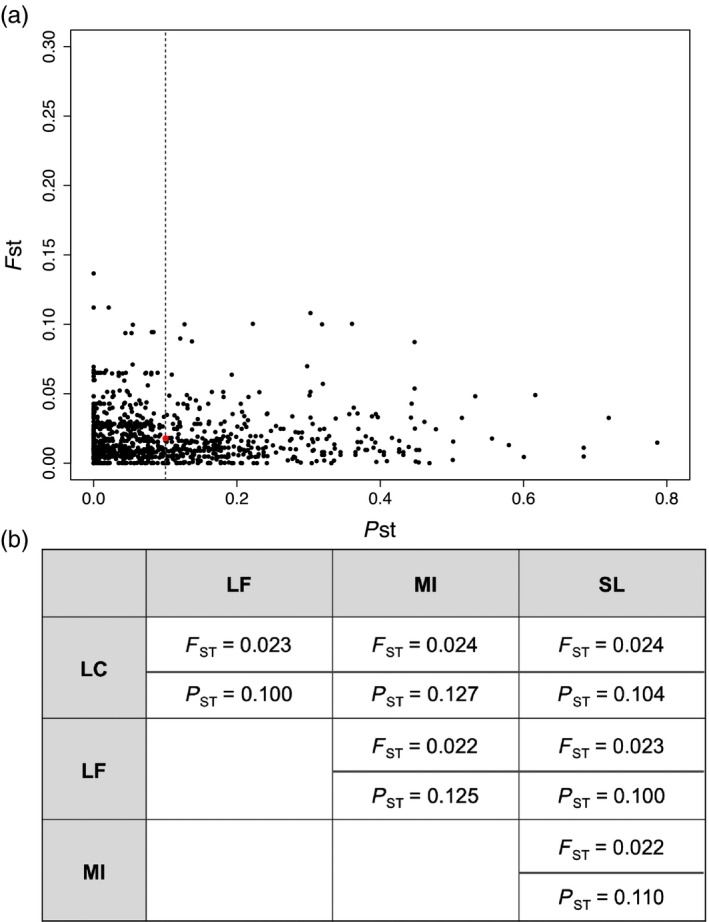
(a) Per locus P ST plotted against F ST for loci shared between the two datasets. The red spot identifies the intersection of the observed mean F ST and mean P ST for all loci. (b) Pairwise estimates of F ST and P ST for all loci
Official websites use .gov
A
.gov website belongs to an official
government organization in the United States.
Secure .gov websites use HTTPS
A lock (
) or https:// means you've safely
connected to the .gov website. Share sensitive
information only on official, secure websites.
(a) Per locus P ST plotted against F ST for loci shared between the two datasets. The red spot identifies the intersection of the observed mean F ST and mean P ST for all loci. (b) Pairwise estimates of F ST and P ST for all loci