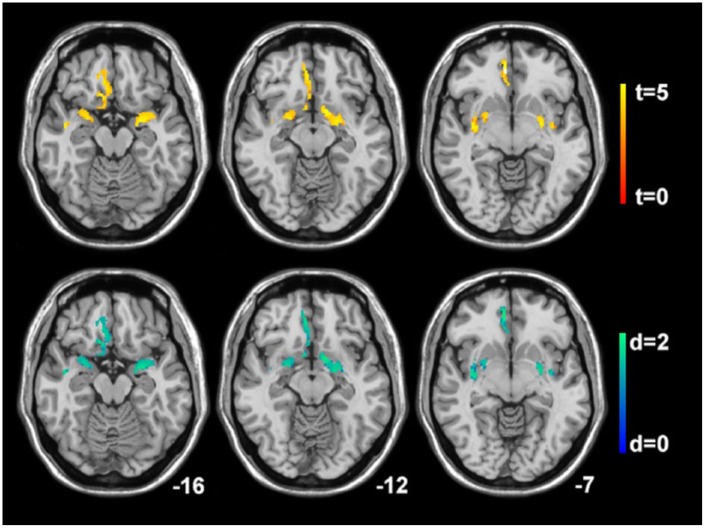
Figure 2.
Correlations of gray matter concentration decreases and the combined olfactory function discrimination and identification score. Statistical parametric mapping (t-value) axial intensity projection maps showing areas of significant positive correlations of gray matter concentration decreases and the combined olfactory function discrimination and identification score (upper panel) and its effect size representing Cohen’s d values (lower panel) in a cohort of patients with multiple sclerosis rendered on to a stereotactically normalized magnetic resonance imaging scan. The number at the bottom right corner of each MRI scan corresponds to the z coordinate in Montreal Neurological Institute space.

