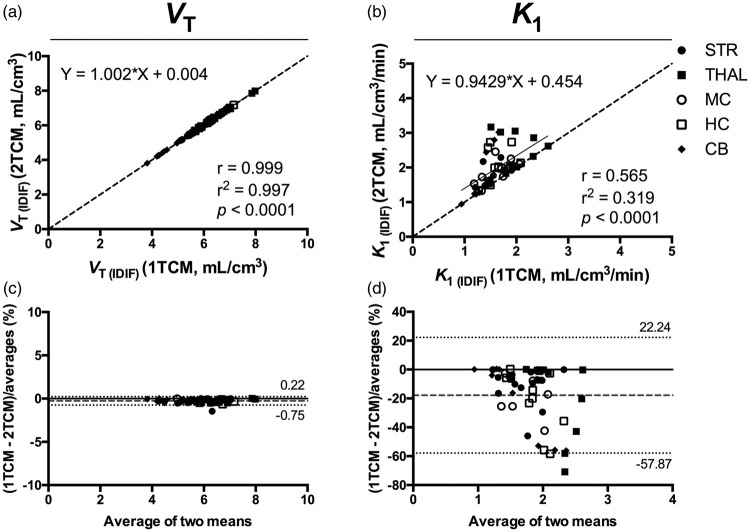
Figure 2.
Comparison of the total volume of distribution (VT) and K1 values determined using 1TCM and 2TCM based on IDIF. Correlation of the VT (IDIF) (a) and K1 (IDIF) (b) values calculated using 1TCM and 2TCM based on 90-min acquisition. The solid line represents the linear regression, while the dashed line depicts the identity line. (c and d) Bland–Altman plot to compare 1TCM and 2TCM in estimation of VT (IDIF) and K1 (IDIF), respectively. Dashed line represents the bias between the two approaches, while the dotted lines denote the 95% limits of agreement. n = 10. Each symbol represents a different region. 1TCM: one-tissue compartmental model; 2TCM: two-tissue compartmental model; VT (IDIF): total volume of distribution using IDIF.

