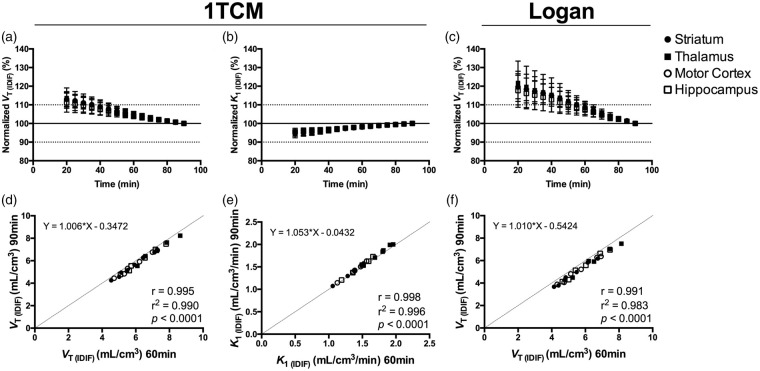
Figure 4.
Time stability of the outcome parameters in different brain regions. VT (IDIF) and K1 (IDIF) calculated using 1TCM (a and b) and VT (IDIF) based on Logan plot (c) normalized to the values obtained during 90-min acquisition. Correlations of the outcome parameters VT (IDIF) and K1 (IDIF) calculated using 1TCM (d and e) and VT (IDIF) based on Logan plot (f) when shortening the acquisition time from 90 to 60 min. n = 10. 1TCM = one-tissue compartmental model, VT (IDIF) = total volume of distribution using IDIF.

