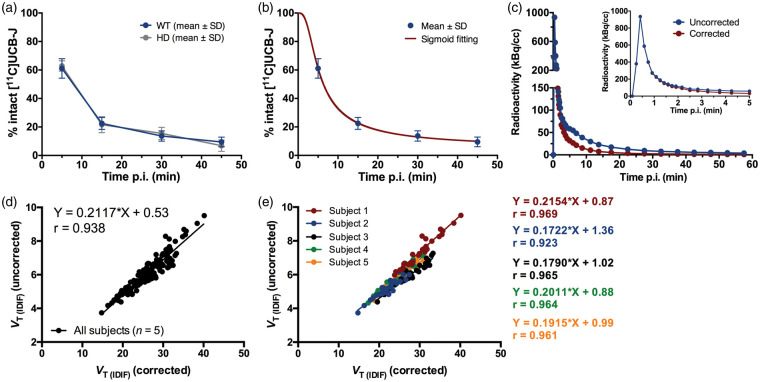
Figure 5.
Population-based plasma metabolism of [11C]UCB-J in mice. (a) Population-based curve of intact [11C]UCB-J in plasma of healthy wild-type (WT) and diseased (model of Huntington's disease, HD) mice. n = 3 per genotype at each time point. (b) Sigmoid fitting curve of the intact [11C]UCB-J in WT mice. (c) Comparison of representative image-derived input functions (IDIF) corrected and uncorrected for the population-based sigmoid fitting of intact [11C]UCB-J. Scatter plots between VT (IDIF) (Logan) corrected and uncorrected for the population-based sigmoid fitting of intact [11C]UCB-J based on a total of five WT mice (d) and correlations for each individual WT mouse (e) in different brain regions. Individual animals presented different regression line equations.

