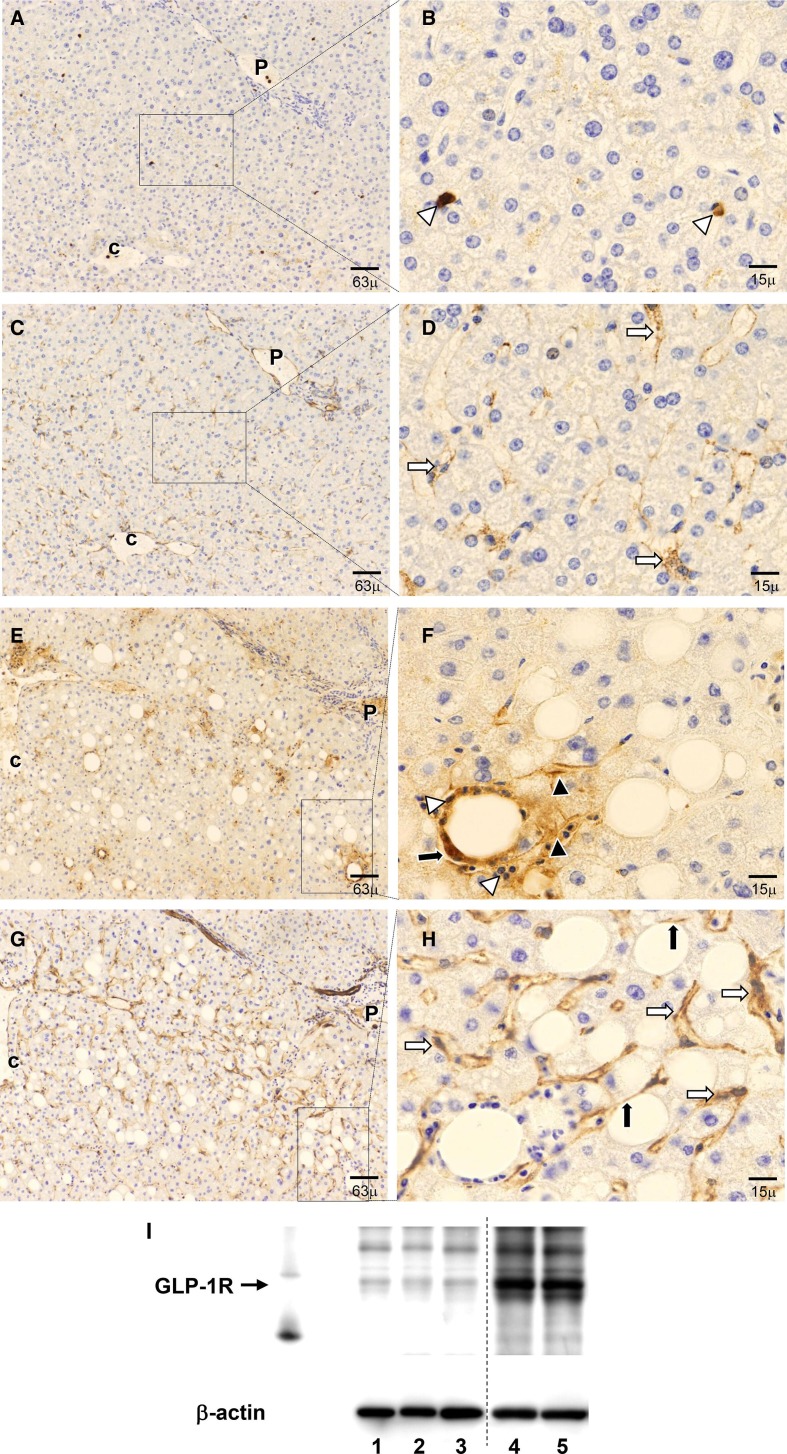
Figure 1.
Immunohistochemistry and western blot analysis of glucagon-like peptide 1 receptor (GLP-1R) and caveolin-1 (CAV-1) in serial sections of normal and non-alcoholic steatohepatitis (NASH) liver. (A, B) Expression of GLP-1R (brown) in normal liver. A few cells showed low expression of GLP-1R in control liver. (C, D) Expressions of CAV-1 (brown) in normal liver. CAV-1 is expressed in the hepatic artery, capillary venule and portal vein in the portal tract (P), and in the cells lining the hepatic sinusoids around pericentral zone 3. The left and right panels show low-magnification and high-magnification images, respectively, of the pericentral region. (A, C) Low magnification (×100). (B, D) High magnification (×400). (E–H) Expression of GLP-1R and CAV-1 in NASH liver. (E) Expression of GLP-1R was observed in hepatocytes and inflammatory cells. (F) Most GLP-1R-positive cells were hepatocytes at the basolateral membrane with macrovesicular steatosis and mononuclear cells. (G) CAV-1 expression is evident mainly in the sinusoidal lining cells. (H) CAV-1 expression in hepatocyte lipid droplets (LDs). Left and right panels show low-magnification and high-magnification images of the central vein, respectively. (E, G) Low magnification (×100). (F, H) High magnification (×400). White arrows indicate the sinusoidal lining cells and black arrows indicate the LDs of macrovesicular cells. Black arrowheads indicate the hepatocyte basolateral membrane and white arrowheads indicate mononuclear cells. P denotes the portal tract; C denotes the central vein. (I) Western blot analysis of GLP-1R expression in control and NASH liver lysates. Lysates containing 30 µg protein were subjected to Sodium dodecyl sulfate polyacrylamide gel electrophoresis (SDS-PAGE) and analysed by western blotting. Lanes 1–3: normal liver; lanes 4 and 5: NASH liver. GLP-1R protein expression was significantly higher in NASH.

