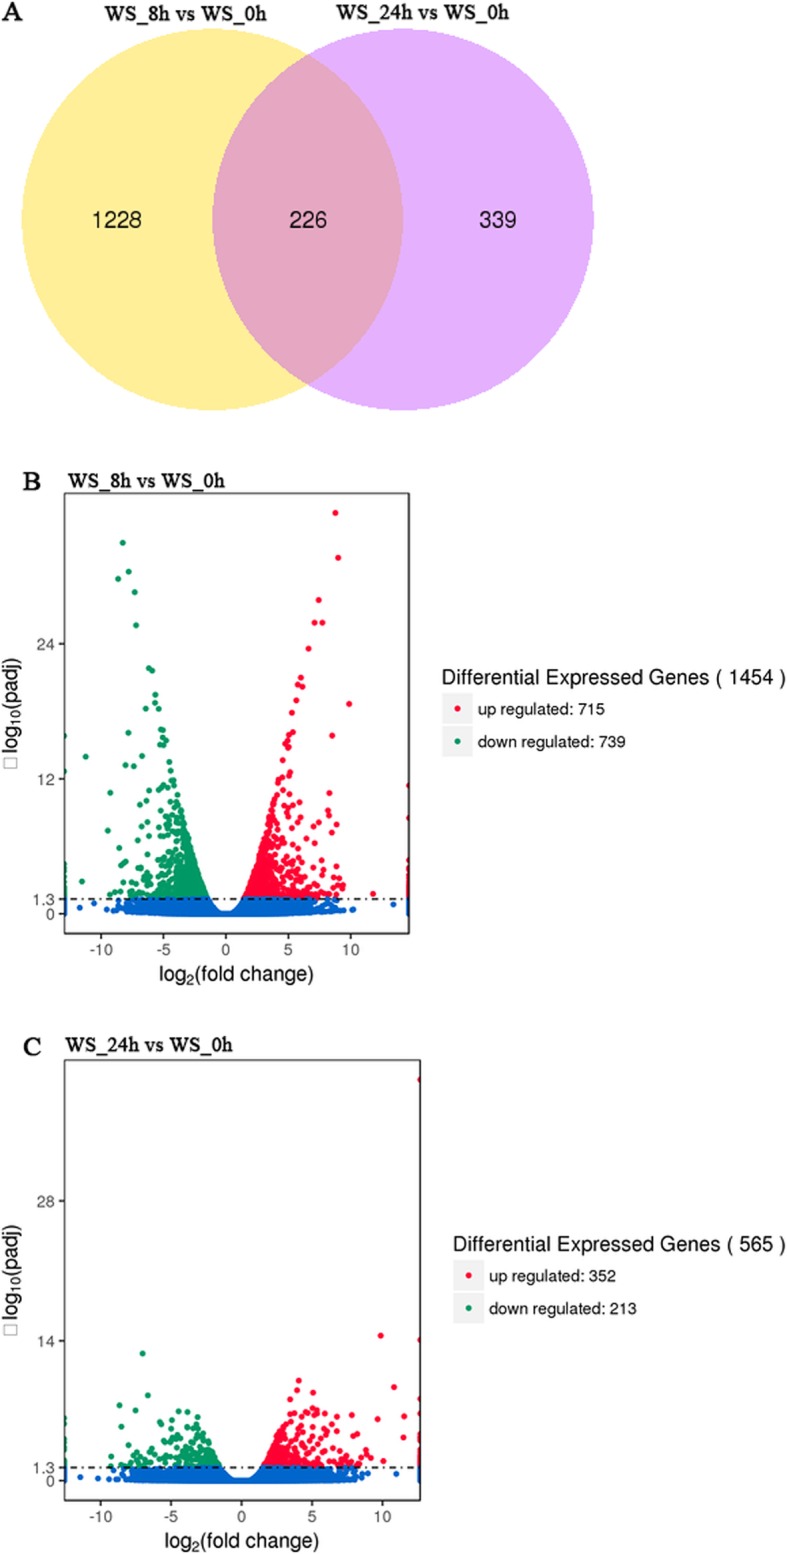
Fig. 1.

Venn diagrams and Volcano map of DEGs under flooding treatment in orchardgrass plantlets. a: Comparison of differentially expressed genes at 8 h and 24 h after flooding treatment with treatment for 0 h (CK); The numbers of DEGs with common were shown in the overlapping region. The total numbers of up- or down-regulated genes in each treatment were the sum of the numbers in each circle. b, c: Up-regulation and down-regulation of differential genes in 8 h, 24 h flooding treatment. The numbers of DEGs with common or opposite expression change tendencies between treatments were shown in the overlapping regions. The total numbers of up- or down-regulated genes in each treatment were the sum of the numbers in each circle
