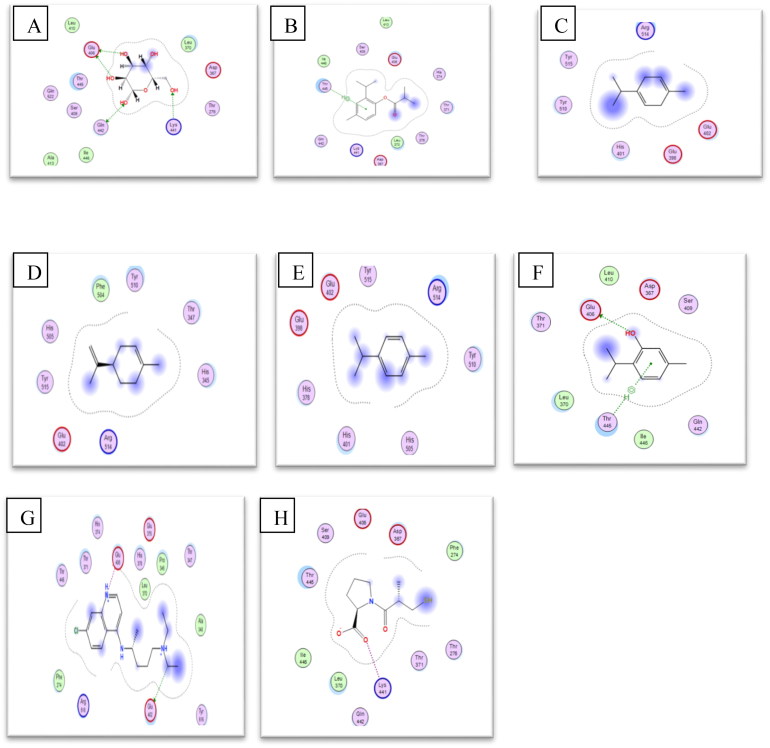
Figure 5.
2 D representations of the best pose interactions between the ligands and their receptor. A. interaction between β-D-Mannose (Co-cristallized ligand) and ACE2, B. interaction between Isothymol and ACE2, C. interaction between limonene and ACE2, D. interaction between p-cymene and ACE2, E. interaction between γ-terpinene and ACE2,F. interaction between Thymol and ACE2, G. interaction between Chloroquine and ACE2, H. interaction between Captopril and ACE2. The 2 D representations of the best pose interactions between the ligands and their respective receptors were visualized using Molecular Operating Environment (MOE).

