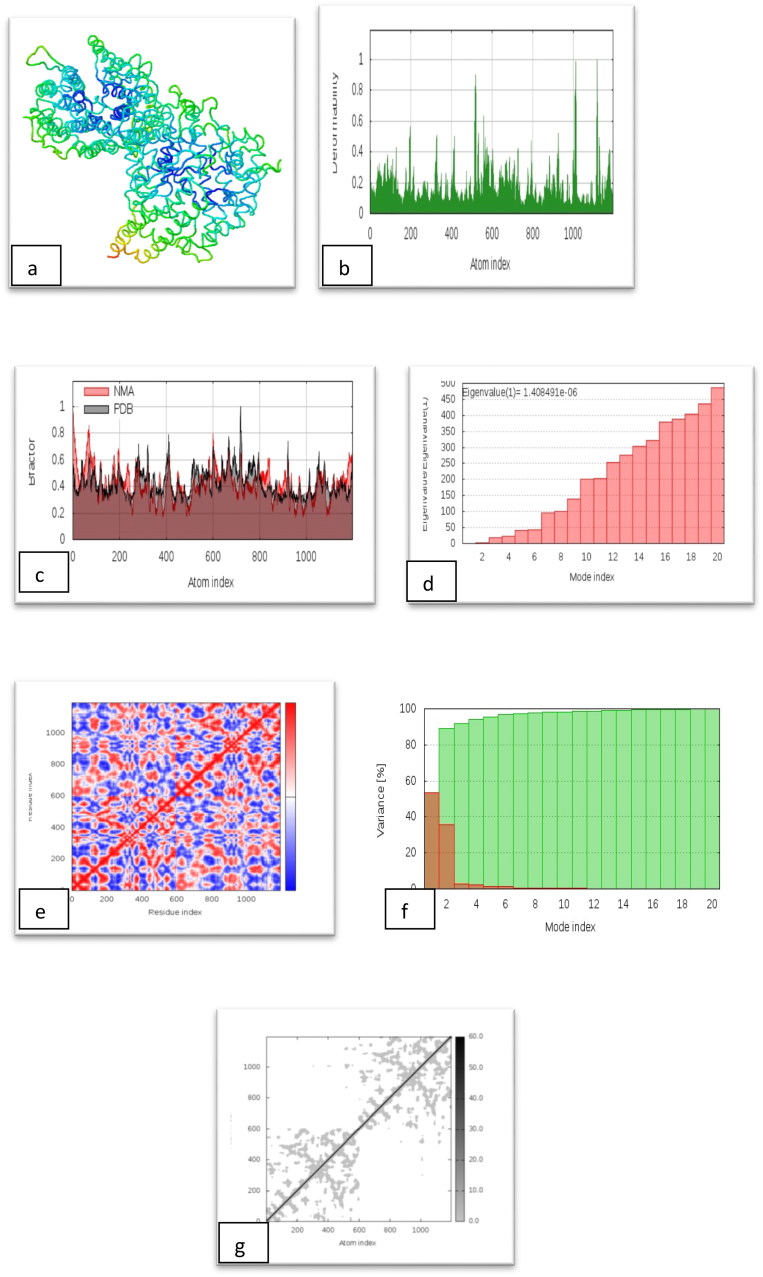
Figure 8.
Results of molecular dynamics simulation of Isothymol-ACE2 Receptor. (a) NMA mobility, (b) deformability, (c) B-factor, (d) eigenvalues, (e) variance (red color indicates individual variances and green color indicates cumulative variances), (f) co-variance map (correlated (red), uncorrelated (white) or anti-correlated (blue) motions) and (g) elastic network (darker gray regions indicate more stiffer regions) of the complex.

