. 2020 May 14:1–14. doi: 10.1080/07391102.2020.1763199

Table 1.

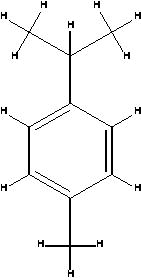
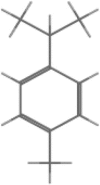
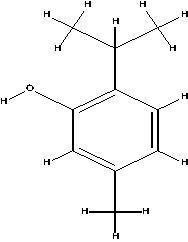
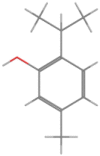
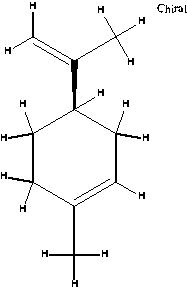
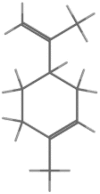
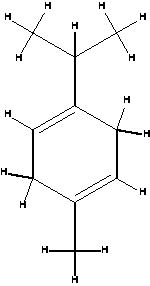
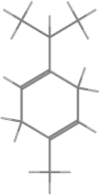
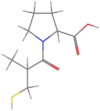
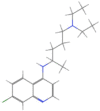
2 D&3D representations of the all ligands used in the experiment. The ligands structures were taken from PubChem server (www.pubchem.ncbi.nlm.nih.gov).

Compound name 2D Structure 3D Structure
Isothymol graphic file with name TBSD_A_1763199_ILG0001_B.gif graphic file with name TBSD_A_1763199_ILG0002_C.gif
p-cymene graphic file with name TBSD_A_1763199_ILG0003_B.gif graphic file with name TBSD_A_1763199_ILG0004_B.gif
Thymol graphic file with name TBSD_A_1763199_ILG0005_B.gif graphic file with name TBSD_A_1763199_ILG0006_C.gif
limonene graphic file with name TBSD_A_1763199_ILG0007_B.gif graphic file with name TBSD_A_1763199_ILG0008_B.gif
γ-terpinene graphic file with name TBSD_A_1763199_ILG0009_B.gif graphic file with name TBSD_A_1763199_ILG0010_C.gif
beta-D-Mannose (Co-cristallized ligand) graphic file with name TBSD_A_1763199_ILG0011_B.gif graphic file with name TBSD_A_1763199_ILG0012_C.gif
Captopril graphic file with name TBSD_A_1763199_ILG0013_B.gif graphic file with name TBSD_A_1763199_ILG0014_C.gif
Chloroquine graphic file with name TBSD_A_1763199_ILG0015_B.gif graphic file with name TBSD_A_1763199_ILG0016_C.gif