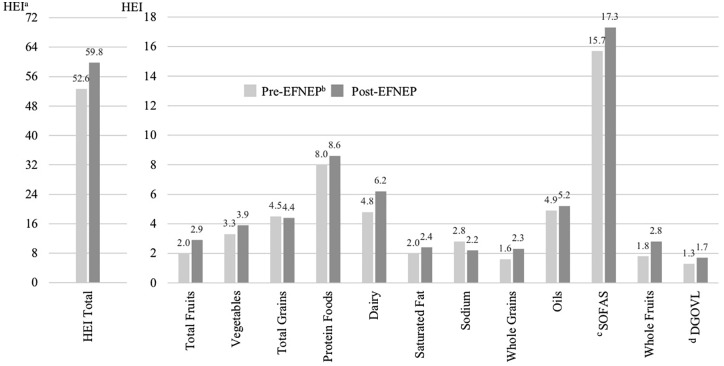
Figure 1.
Mean HEI scores and subscores of Maine EFNEP participants.1
1 aHEI, Healthy Eating Index; bEFNEP, Expanded Food and Nutrition Education Program; cSoFAS, solid fats and added sugars; dDGOVL, dark green and orange vegetables and legumes. Data range from 2013 to 2016. Differences in means of HEI scores from pre-EFNEP to post-EFNEP are statistically significant at the 1% level except total grains and saturated fat (significant at the 5% level) and oils (not significant).

