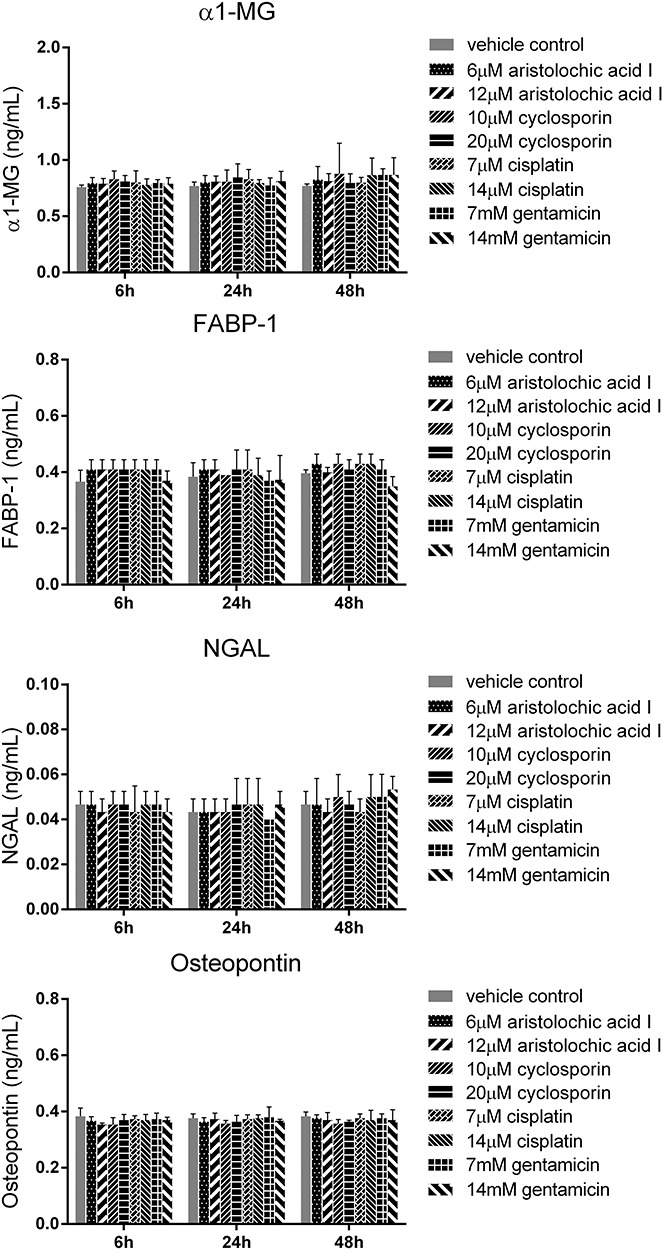
Figure 5.

The protein levels of α1-MG, FABP-1, NGAL and osteopontin in RPTEC/TERT1 cell treated with cisplatin, cyclosporin, aristolochic acid I and gentamicin for 6, 24 and 48 h (mean ± SD, n = 3). Asterisk indicates significantly different from the vehicle control value (P < 0.05).
