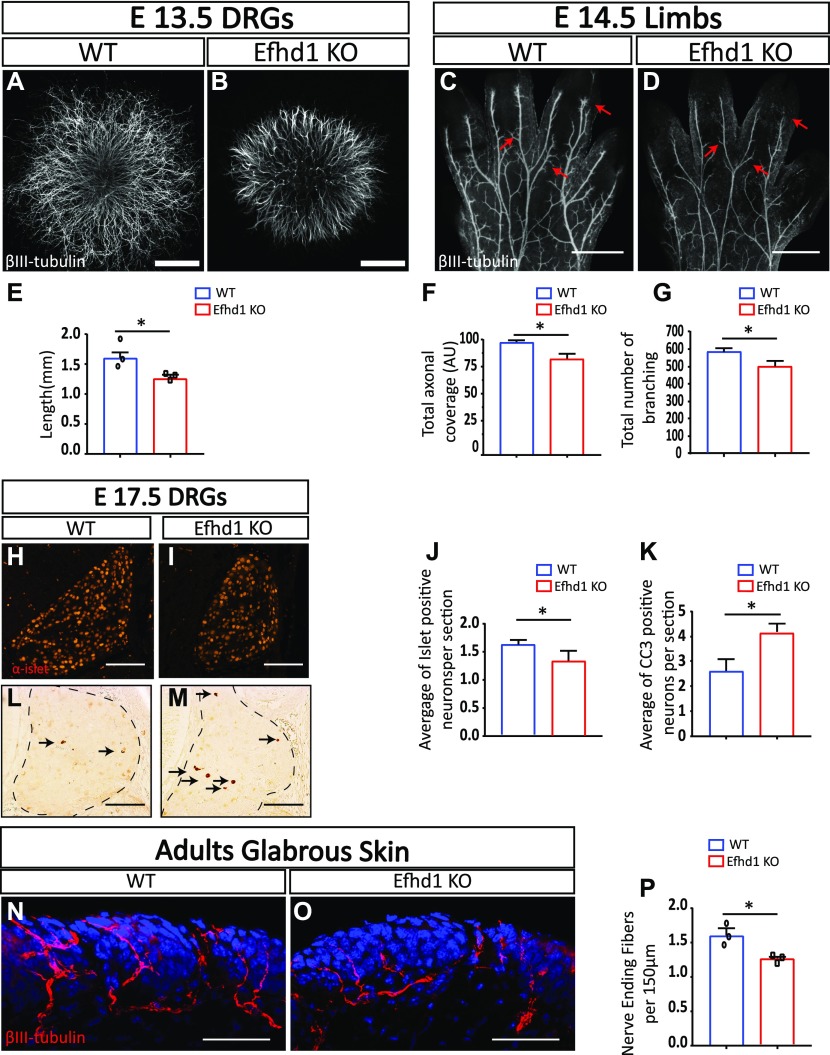
Figure 2. Efhd1 KO neurons exhibit reduced axonal morphogenesis, neuronal cell loss, and decreased target innervation.
(A, B) Dorsal root ganglion (DRG) explants placed in 3D collagen from WT and Efhd1 KO E13.5 mouse embryos stained with α-βIII-tubulin. Scale bar: 1,000 μm. (C, D) Limbs from WT and Efhd1 KO E14.5 mouse embryos, stained with α-βIII-tubulin. Arrows point missing axonal branches in the Efhd1 KO. Scale bar: 500 μm. (E) Axonal lengths of eight WT and eight Efhd1 KO DRGs were quantified by four measurements in three independent experiments (N = 3). Graph shows means ± SEM (unpaired t test *P = 0.0237). (F) Overall axonal coverage (total axonal length that cover the limb’s surface). Graph shows means ± SEM (unpaired t test *P = 0.038). (G) Total number of branching was quantified. Graphs show means ± SEM (unpaired t test *P = 0.032). (F, G) Seven WT (N = 7) and eight Efhd1 KO (N = 8) embryos were analyzed in (F, G), data for each embryo represent the average measurements of both limbs. (H, I) E17.5 WT and Efdh1 KO mouse embryos were stained with anti-Islet1. Scale bar: 100 μm. (J) Graph shows means ± SEM (unpaired t test *P = 0.011). (L, M) E17.5 WT and Efdh1 KO mouse embryos were stained with anti-cleaved caspase-3 (CC3). Scale bar: 100 μm. (K) Graph shows means ± SEM (unpaired t test *P = 0.020). Arrows point to the CC3-positive cells in the DRGs. (J, K) Five WT (N = 5) and seven Efhd1 KO (N = 7) embryos were analyzed, and the numbers of Islet1-positive neurons (J) and of CC3 positive (K) were quantified in 60 sections/embryo. (N, O) Glabrous skin of adult hind limbs from WT and Efdh1 KO adult mice was stained with α-βIII-tubulin and visualized by confocal microscopy. Scale bar 100 μm. (P) Nerve-ending fiber quantification. Graph shows means ± SEM (unpaired t test *P = 0.013). 25 sections from each left hind limb of three WT (N = 3) and three Efhd1 KO (N = 3) adult animals were analyzed.

