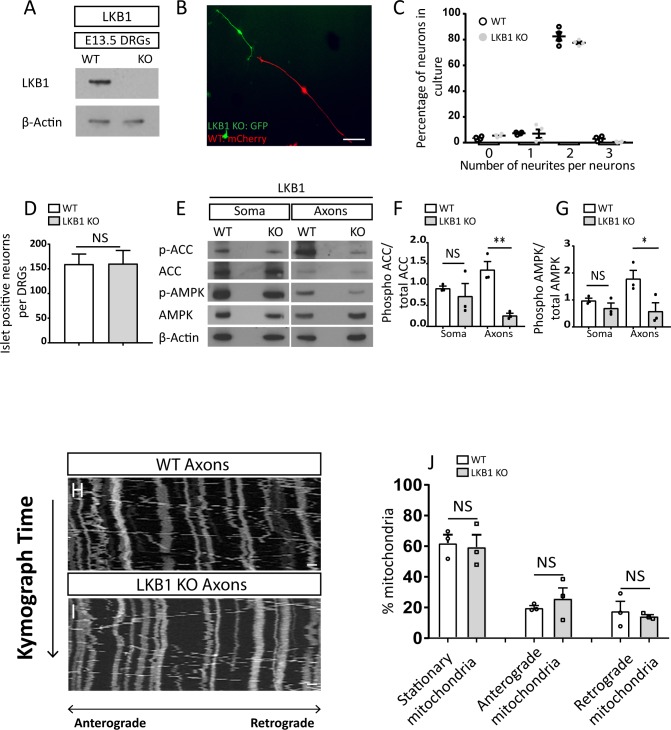
Figure S1. Liver kinase B1 (Lkb1) ablation by Wnt1–cre causes metabolic abnormalities.
(A) Immunoblot of WT and Lkb1 KO of dorsal root ganglions (DRGs) from E13.5 embryos. (B) Mixed culture of WT and Lkb1 KO DRGs from E12.5 embryos transfected with two different plasmids, WT: mCherry, Lkb1 KO: GFP. Neurons were fixed and directly visualized after 48 h. Scale bar 500 μm. (C) Quantification of number of neurites per cells was analyzed. Graph shows means ± SEM based on four independent experiments (N = 4), 30 neurons in each experiment were analyzed (unpaired t test NS). (D) Quantification of Islet1 positive-neurons in E15.5 WT and Lkb1 KO DRGs. Six WT (N = 6) and six Lkb1 KO (N = 6) embryos were analyzed, for each embryo, 60 sections/embryo. Graph shows means ± SEM (unpaired t test NS). (E) Immunoblot analysis of phosphorylation levels of AMPK (Thr172) and acetyl CoA carboxylase (ACC) (Ser72) in soma and axons of DRG explants plated on insert filter cultures for 48 h. (F, G) Phosphorylation levels/total levels of ACC (F) and AMPK (G) were normalized on β-actin and quantified with ImageJ. Graphs show mean ± SEM based on three individual experiments (N = 3). (F, G) ACC: unpaired t test with Welch’s correction soma NS, unpaired t test axons **P = 0.005, (G) AMPK: unpaired t test soma NS, unpaired t test axons *P = 0.04. (H, I) Mitochondrial kymograph of axonal mitochondria motility in dissociated neurons from E13.5 WT and Lkb1 KO DRGs. Scale bar 2 μm. (J) Quantification of the percentage of stationary, anterograde, and retrograde mitochondria in WT and Lkb1 KO neurons. Neurons were dissected from three WT and three Lkb1 KO embryos. All graphs show means ± SEM based on three individual experiments (N = 3), DRGs (stationary mitochondria: unpaired-test NS, anterograde mitochondria: unpaired t test NS, retrograde mitochondria: unpaired t test with Welch’s correction NS).
Source data are available for this figure.

