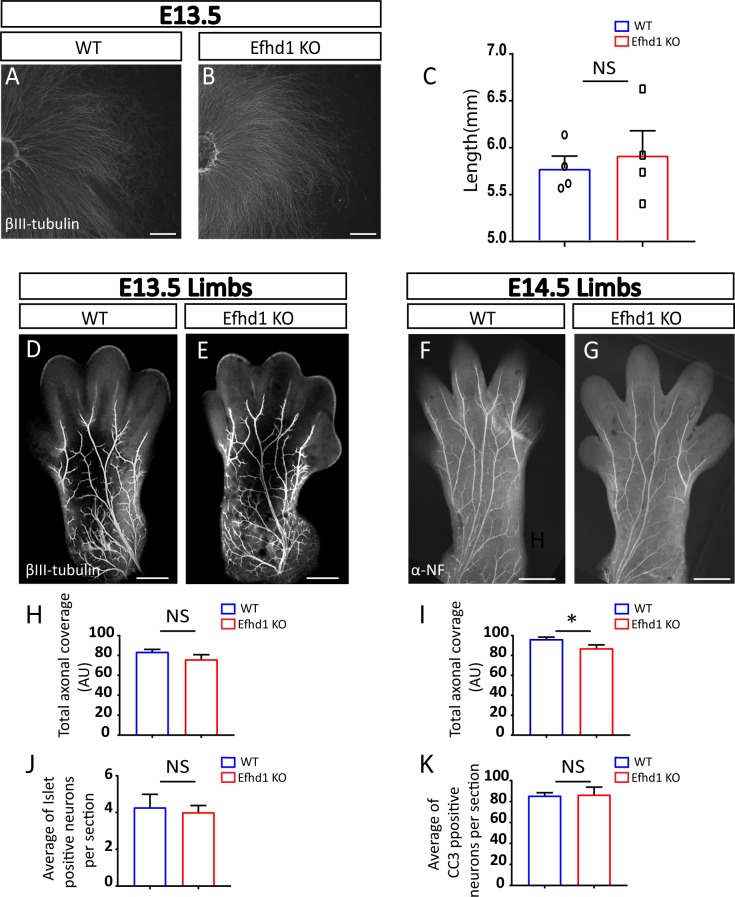
Figure S4. Efhd1 KO embryos show reduced axonal growth in vivo.
(A, B) Dorsal root ganglions (DRGs) from E13.5 embryos from WT and Lkb1 KO E13.5 mouse embryos were plated on poly-D-lysine/laminin and stained with α-βIII-tubulin. Scale bar 1,000 μm. (C) Axonal length of eight WT and eight Efhd1 KO DRG explants were quantified by four measurements in four independent experiments (N = 4). Graphs show means ± SEM (unpaired t test NS). (D, E) α-βIII-tubulin immunostaining of E13.5 limbs of WT and Efhd1 KO embryos. Scale bar 500 μm. (F, G) Analysis of axonal morphogenesis in E14.5 limbs of WT and Efdh1 KO embryos as visualized by α-neurofilament staining. Scale bar 500 μm. (H) Quantification of overall axonal coverage (total axonal length that cover the limb’s surface) in WT and Efhd1 KO E13.5 limbs. Five WT embryos (N = 5) and nine Efhd1 KO (N = 9) embryos were analyzed; data for each embryo represent the average axonal coverage of both limbs. Graphs show mean ± SEM (unpaired t test NS). (I) Quantification of the overall axonal coverage (total axonal length that cover the limb’s surface) in WT and Efdh1 KO E14.5 limbs. Six WT embryos (N = 6) and eight Efhd1 KO (N = 8) embryos were analyzed; data for each embryo represent the average of axonal coverage of both limbs. Graphs show means ± SEM (unpaired t test *P = 0.04). (J, K) Quantification of (J) Islet1 neurons and (K) apoptotic rate (anti-cleaved caspase-3 staining [CC3] in E15 WT and Efhd1 KO DRGs). Six embryos of each genotype were analyzed (N = 6), with 60 sections/embryo. Graphs show mean ± SEM (unpaired t test NS).

