
Figure 2.
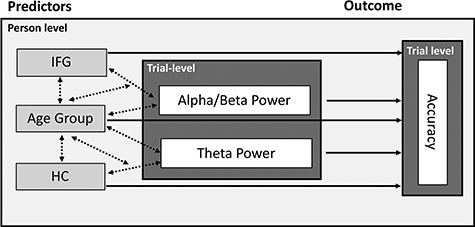
Illustration of the mixed-effects model. On the trial level, alpha/beta power and theta power are used to predict single-trial accuracy. Person-level predictors are measures of structural integrity (IFG and HC) and age group. Tested main effects are represented by solid lines and single-headed arrows, and interactions by dotted lines and double-headed arrows. IFG: inferior frontal gyrus; HC: hippocampus.