
Figure 5.
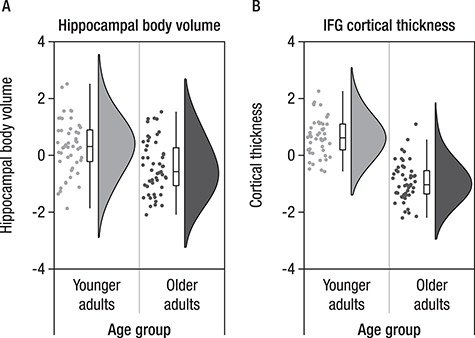
Hippocampal body volume (A) and cortical thickness of inferior frontal gyrus (IFG) (B) shown for each participant (indicated by individual points) together with boxplots and sample density, separated by age group. Older adults (dark gray) show lower IFG cortical thickness and lower hippocampal volume than do younger adults (light gray).