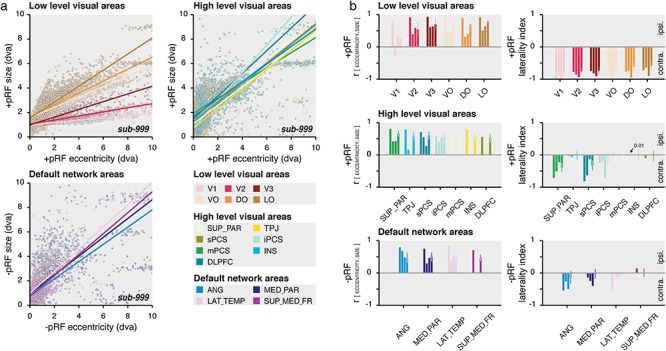
Figure 3.

DN visual characteristics. (a) pRF eccentricity and size relationship. Size as a function of the eccentricity of +pRFs within low- (top left panel) and high-level visual areas (top right panel) and of −pRFs of the DN areas (bottom left panel), for the averaged time samples across the HCP subjects (sub-999). Dots represent individual cortical vertex (see color legend) and lines show the best explained linear function weighted by the pRF explained variance (R2). (b) Correlation and laterality index. Left panels show the correlation coefficient (r) between the pRF eccentricity and size parameters weighted by the pRF explained variance (R2) and right panels show the laterality index of +pRFs within low- (top left panel) and high-level visual areas (middle left panel) and of −pRFs of the DN areas (bottom left panel). The results of sub-999, sub-001, sub-002 and sub-000 are shown per region of interest in order from the leftmost to the rightmost bar. The most frontal areas of sub-001 and sub-002 (mPCS, INS, DLPFC and SUP_MED_FR) are not reported. Error bars show the STD across the HCP subjects.
