
Figure 3.
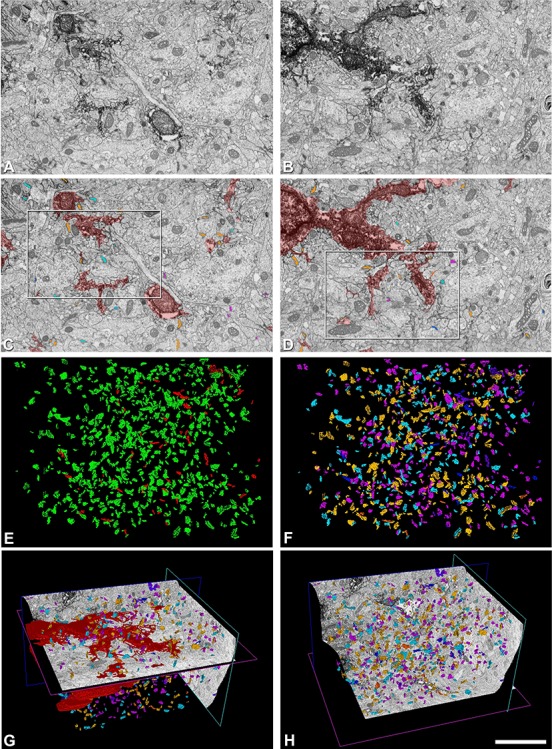
Example of FIB/SEM imaging, segmentation, and 3D visualization. A, B, Images 88 and 147 from a stack of images. Electron dense deposits of DAB are visible within astrocytic compartments (soma and processes) in the FIB/SEM images. C, D, Same FIB/SEM images as in A and B, respectively, with segmented structures (astrocytic compartments in red; synapses: asymmetric “Cleft Ast” in light orange, asymmetric “Pre/Post Ast” in light blue, asymmetric “Free Ast” in light purple, symmetric “Cleft Ast” in dark orange, symmetric “Pre/Post Ast” in dark blue, and symmetric “Free Ast” in dark purple). White rectangles in C, D surround regions shown at higher magnification in Supplementary Figure 1. E, Frontal 3D view of the asymmetric (green) and symmetric (red) segmented synapses. F, Frontal 3D view of the asymmetric and symmetric segmented synapses classified—according to their contacts with the labeled astrocytic compartments—as “Cleft Ast”, “Pre/Post Ast,” or “Free Ast” (colors as already stated). G, Diagonal 3D view showing orthogonal axis from the FIB/SEM stack of images and segmented structures (astrocytes and synapses; colors and synaptic classifications as already stated). H, Diagonal 3D view showing orthogonal axis from the FIB/SEM stack of images and segmented synapses (colors and synaptic classifications as already stated). This particular example corresponds to sample 4 from astrocyte 1. Scale bar shown in H indicates 2.7 μm in A–F and 5.7 μm in G, H.