
Figure 9.
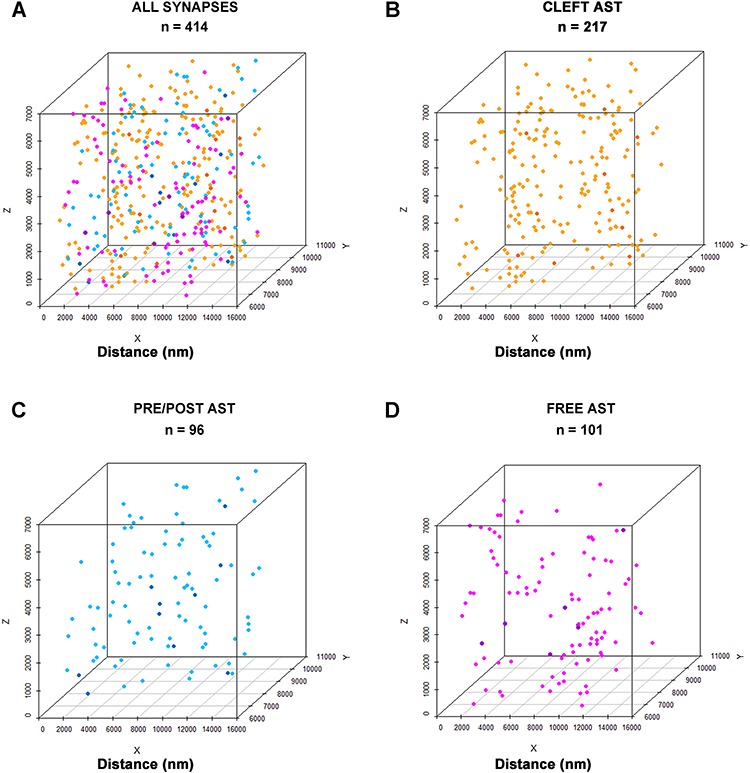
Example of the analysis of the 3D spatial distribution of synapses. In this example, all synapses present in sample 1.1 were analyzed together (ALL SYNAPSES; A) and then separated into three groups according to their relationship with astrocytic processes: “Cleft Ast synapses” (CLEFT AST, B), “Pre/Post Ast synapses,” (PRE/POST AST, C) and “Free Ast synapses” (FREE AST, D). For each group of synapses, we recorded the spatial positions of the centers of gravity or centroids of synaptic junctions, as represented in the 3D scatter plots. In this particular sample, there were 414 synapses, 217 of which were CLEFT AST (orange), 96 PRE/POST AST (blue), and 101 FREE AST (magenta). Three spatial statistical functions (F, G, and K) were calculated for each group of synapses (see the corresponding spatial statistics analysis in Supplementary Figs 3–6). The spatial distributions of ALL SYNAPSES, CLEFT AST, and PRE/POST AST were nearly random, while the spatial distribution of FREE AST was clustered.