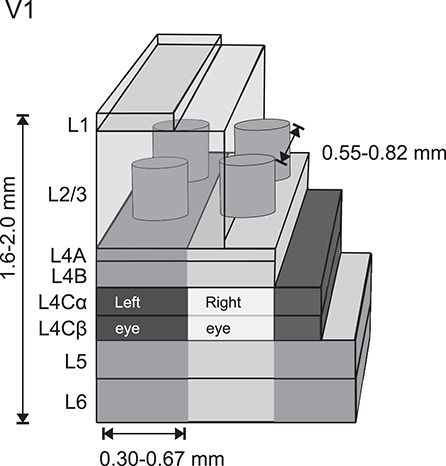
Figure 1.

Schematics of CO and ocular dominance modules in V1. The cylinders in L3 depict CO blobs and the lighter and darker columnar gray bands the ODCs, most emphasized in L4C (Hubel and Wiesel 1968). References for cortical thickness (range of means; Chow et al. 1950; Lund 1973; O’Kusky and Colonnier 1982b); layer thickness is drawn approximately to scale (Lund 1973); reported distance between CO blobs is the range across monkeys (Horton 1984; Landisman and Ts’o 2002); reported width of ODC is the range across monkeys (LeVay et al. 1975; Horton and Hocking 1996).
