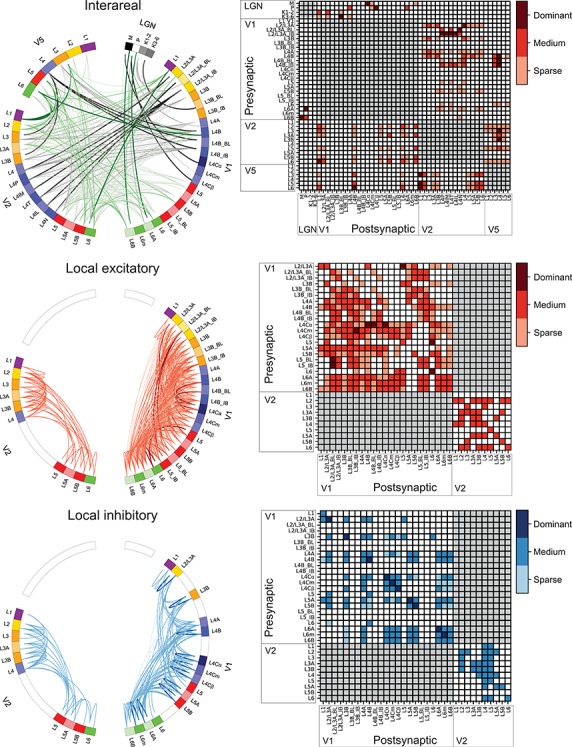
Figure 2.

Connections between LGN, V1, V2, and V5 and within V1 and V2. For references, see Supplementary Table 1D. Top, middle, and bottom rows indicate interareal, intra-areal excitatory, and intra-areal inhibitory connections, respectively. LEFT COLUMN: Connectograms (Krzywinski et al. 2009) showing connections between distinct layers. Each colored segment in the circular perimeter indicates a cortical layer, sublayer, or CO compartment. Line width and color intensity indicate the robustness of the connection. Unknown strengths are marked as medium; for V2 interlaminar connections (middle and bottom connectograms), the paucity and qualitative character of the available studies did not allow us to estimate connection strength. The origin (soma) of a projection neuron is marked as a line slightly displaced from the outer edge of the circle, while its termination (axon terminals) is marked as a line reaching the outer edge of the circle. “Top left”: Interareal connections and connections between LGN and areas V1, V2, and V5. Black lines indicate FF connections and green lines FB connections. V2 L4P = L4 pale stripe (no distinction between lateral/medial stripes), L4IM = L4 interstripe (or pale stripe) medial, L4T = L4 thick stripe, L4IL = L4 interstripe (or pale) lateral, L4N = L4 thin stripe. All interareal connections are excitatory. “Middle left”: Local excitatory connections. “Bottom left”: Local inhibitory connections; none of the studies reviewed here identified the CO compartments. RIGHT COLUMN: Matrix of the connections. No connection (white squares) indicates that the connection either does not exist or was not studied. Red squares indicate excitatory connections and blue squares inhibitory connections. Color intensity indicates the strength of the connection.
