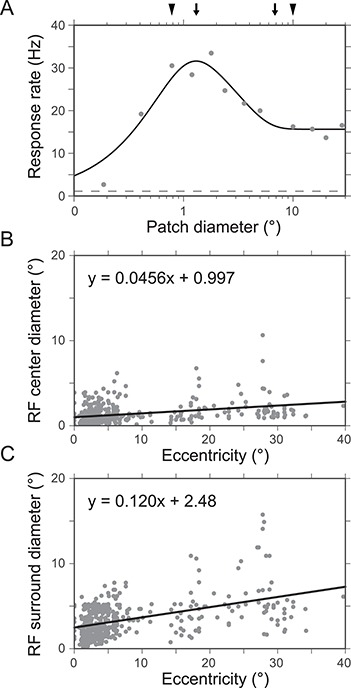
Figure 6.

ASF in V1. (A) ASF for an example V1 neuron. Solid line represents fit to the data (dots) using the DoG model. Dashed line indicates the mean spontaneous firing rate. Arrows indicate the center and surround diameters obtained using the DoG fit. Arrowheads indicate the center and surround diameters extracted from the empirically measured responses (without any fit). Data from Shushruth et al. (2009). (B) RF center diameter with respect to eccentricity. Solid line represents linear fit to the data (dots, N = 425). (C) RF surround diameter with respect to eccentricity. Solid line represents linear fit to the data (dots, N = 425). (B and C) data from Cavanaugh et al. (2002).
