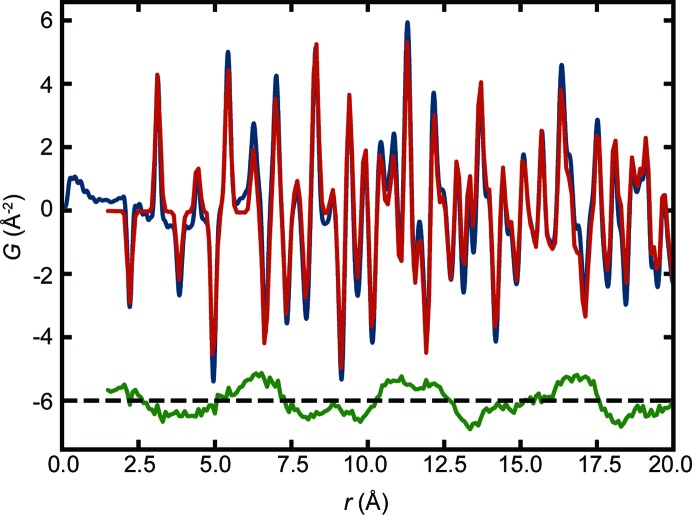
Figure 8.
The neutron PDF of the MnO data (blue curve) measured at 15 K with the best-fit calculated atomic PDF (red) for the MPD No. 41, rhombohedral MnO model from heuristic 2. The difference curve is shown offset below (green). Notice the strong magnetic PDF signal in the difference curve, which did not confuse structure-mining.

